
|
Archean Chemical Industries Limited (ACI.NS) Évaluation DCF |
Entièrement Modifiable: Adapté À Vos Besoins Dans Excel Ou Sheets
Conception Professionnelle: Modèles Fiables Et Conformes Aux Normes Du Secteur
Pré-Construits Pour Une Utilisation Rapide Et Efficace
Compatible MAC/PC, entièrement débloqué
Aucune Expertise N'Est Requise; Facile À Suivre
Archean Chemical Industries Limited (ACI.NS) Bundle
Évaluez les perspectives financières de Archean Chemical Industries Limited comme un expert! Cette calculatrice DCF (ACINS) vous fournit des données financières pré-remplies et la flexibilité pour modifier la croissance des revenus, le WACC, les marges et d'autres hypothèses cruciales pour s'aligner sur vos projections.
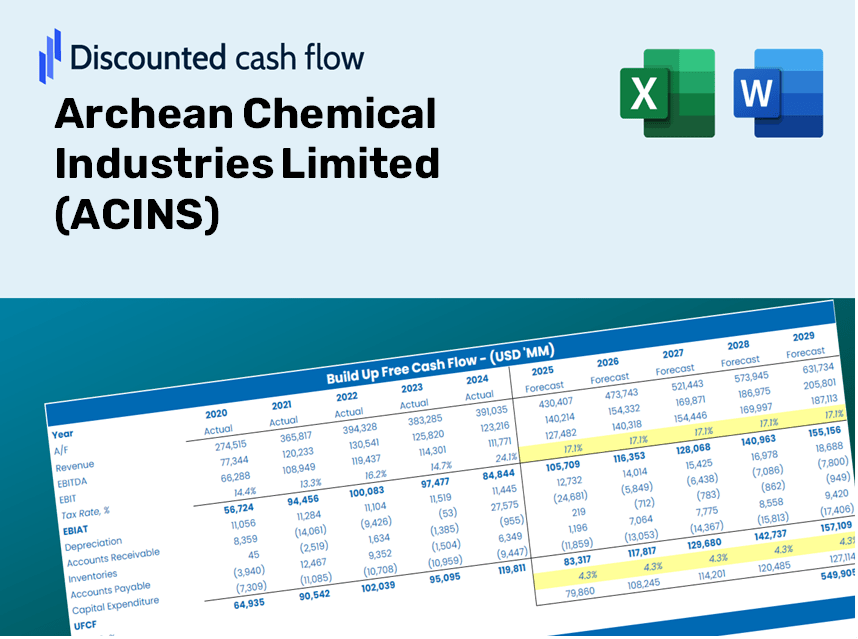
Discounted Cash Flow (DCF) - (USD MM)
| Year | AY1 2021 |
AY2 2022 |
AY3 2023 |
AY4 2024 |
AY5 2025 |
FY1 2026 |
FY2 2027 |
FY3 2028 |
FY4 2029 |
FY5 2030 |
|---|---|---|---|---|---|---|---|---|---|---|
| Revenue | 7,385.1 | 11,295.8 | 14,395.7 | 13,300.9 | 10,410.2 | 11,739.0 | 13,237.5 | 14,927.3 | 16,832.7 | 18,981.4 |
| Revenue Growth, % | 0 | 52.96 | 27.44 | -7.61 | -21.73 | 12.76 | 12.76 | 12.76 | 12.76 | 12.76 |
| EBITDA | 2,761.4 | 4,793.9 | 6,772.1 | 5,058.2 | 3,112.5 | 4,573.6 | 5,157.4 | 5,815.7 | 6,558.1 | 7,395.2 |
| EBITDA, % | 37.39 | 42.44 | 47.04 | 38.03 | 29.9 | 38.96 | 38.96 | 38.96 | 38.96 | 38.96 |
| Depreciation | 554.0 | 668.6 | 686.3 | 703.4 | 793.8 | 730.2 | 823.4 | 928.5 | 1,047.1 | 1,180.7 |
| Depreciation, % | 7.5 | 5.92 | 4.77 | 5.29 | 7.63 | 6.22 | 6.22 | 6.22 | 6.22 | 6.22 |
| EBIT | 2,207.4 | 4,125.3 | 6,085.8 | 4,354.8 | 2,318.7 | 3,843.4 | 4,334.0 | 4,887.2 | 5,511.0 | 6,214.5 |
| EBIT, % | 29.89 | 36.52 | 42.27 | 32.74 | 22.27 | 32.74 | 32.74 | 32.74 | 32.74 | 32.74 |
| Total Cash | 555.3 | 695.1 | 2,310.5 | 3,953.5 | 2,550.1 | 1,970.8 | 2,222.4 | 2,506.1 | 2,826.0 | 3,186.7 |
| Total Cash, percent | .0 | .0 | .0 | .0 | .0 | .0 | .0 | .0 | .0 | .0 |
| Account Receivables | 708.0 | 1,558.7 | 1,190.5 | 1,571.5 | 1,666.6 | 1,396.5 | 1,574.7 | 1,775.7 | 2,002.4 | 2,258.0 |
| Account Receivables, % | 9.59 | 13.8 | 8.27 | 11.82 | 16.01 | 11.9 | 11.9 | 11.9 | 11.9 | 11.9 |
| Inventories | 1,106.3 | 1,207.9 | 1,677.6 | 1,272.9 | 1,681.3 | 1,480.2 | 1,669.2 | 1,882.2 | 2,122.5 | 2,393.5 |
| Inventories, % | 14.98 | 10.69 | 11.65 | 9.57 | 16.15 | 12.61 | 12.61 | 12.61 | 12.61 | 12.61 |
| Accounts Payable | 1,117.8 | 1,122.9 | 955.6 | 998.1 | 1,050.5 | 1,157.7 | 1,305.5 | 1,472.1 | 1,660.1 | 1,872.0 |
| Accounts Payable, % | 15.14 | 9.94 | 6.64 | 7.5 | 10.09 | 9.86 | 9.86 | 9.86 | 9.86 | 9.86 |
| Capital Expenditure | -105.5 | -966.1 | -998.6 | -2,078.9 | -2,635.7 | -1,358.6 | -1,532.0 | -1,727.6 | -1,948.1 | -2,196.8 |
| Capital Expenditure, % | -1.43 | -8.55 | -6.94 | -15.63 | -25.32 | -11.57 | -11.57 | -11.57 | -11.57 | -11.57 |
| Tax Rate, % | 27.54 | 27.54 | 27.54 | 27.54 | 27.54 | 27.54 | 27.54 | 27.54 | 27.54 | 27.54 |
| EBITAT | 1,625.2 | 3,093.2 | 4,550.1 | 3,251.7 | 1,680.2 | 2,848.0 | 3,211.5 | 3,621.5 | 4,083.7 | 4,605.0 |
| Depreciation | ||||||||||
| Changes in Account Receivables | ||||||||||
| Changes in Inventories | ||||||||||
| Changes in Accounts Payable | ||||||||||
| Capital Expenditure | ||||||||||
| UFCF | 1,377.3 | 1,848.5 | 3,968.9 | 1,942.4 | -612.6 | 2,798.0 | 2,283.5 | 2,575.0 | 2,903.7 | 3,274.3 |
| WACC, % | 5.44 | 5.45 | 5.45 | 5.45 | 5.44 | 5.45 | 5.45 | 5.45 | 5.45 | 5.45 |
| PV UFCF | ||||||||||
| SUM PV UFCF | 11,764.1 | |||||||||
| Long Term Growth Rate, % | 2.00 | |||||||||
| Free cash flow (T + 1) | 3,340 | |||||||||
| Terminal Value | 96,936 | |||||||||
| Present Terminal Value | 74,361 | |||||||||
| Enterprise Value | 86,126 | |||||||||
| Net Debt | 1,940 | |||||||||
| Equity Value | 84,185 | |||||||||
| Diluted Shares Outstanding, MM | 124 | |||||||||
| Equity Value Per Share | 681.17 |
Benefits of Choosing Archean Chemical Industries Limited (ACINS)
- Comprehensive Financial Model: Leverage Archean's real data for accurate DCF valuations.
- Complete Forecast Management: Modify revenue growth, profit margins, WACC, and other essential factors.
- Immediate Calculations: Real-time updates provide instant feedback as you adjust your inputs.
- Professional-Grade Template: An expertly crafted Excel file ready for investor presentations.
- Flexible and Reusable: Designed for adaptability, suitable for ongoing detailed forecasting.
Core Capabilities
- Accurate Financial Data for ACINS: Gain access to reliable historical data and future forecasts pre-loaded for your convenience.
- Adjustable Forecast Parameters: Modify the yellow-highlighted cells, including WACC, growth rates, and profit margins to suit your analysis.
- Real-Time Calculations: Benefit from automatic updates to DCF, Net Present Value (NPV), and cash flow assessments.
- User-Friendly Dashboard: Enjoy clear charts and summaries for easy visualization of your valuation findings.
- Designed for All Skill Levels: A straightforward, intuitive layout tailored for investors, CFOs, and consultants alike.
How It Works
- Step 1: Download the Excel spreadsheet.
- Step 2: Review the pre-filled data for Archean Chemical Industries Limited (ACINS) covering historical trends and future projections.
- Step 3: Modify key assumptions (highlighted in yellow cells) based on your insights.
- Step 4: Observe the automatic updates for the intrinsic value of Archean Chemical Industries Limited (ACINS).
- Step 5: Utilize the results for your investment strategies or financial reports.
Why Opt for This Calculator?
- Reliable Data: Accurate financials from Archean Chemical Industries Limited (ACINS) provide trustworthy valuation results.
- Customizable Options: Tailor critical factors such as growth rates, WACC, and tax rates to fit your specific forecasts.
- Efficient: Built-in calculations save you the hassle of starting from the ground up.
- Expert-Level Tool: Crafted for investors, analysts, and industry consultants.
- User-Friendly Experience: An intuitive design and clear instructions ensure ease of use for everyone.
Who Should Use This Product?
- Investors: Accurately assess the fair value of Archean Chemical Industries Limited (ACINS) before making investment choices.
- CFOs: Utilize a high-quality DCF model for comprehensive financial reporting and analysis.
- Consultants: Seamlessly tailor the template for client valuation reports.
- Entrepreneurs: Acquire insights into financial modeling practices employed by leading companies.
- Educators: Implement it as an educational resource to illustrate valuation methodologies.
Contents of the Template
- Preloaded ACINS Data: Historical and forecasted financial information, including revenue, EBIT, and capital expenditures.
- DCF and WACC Models: Professional-level spreadsheets for calculating intrinsic value and Weighted Average Cost of Capital.
- Editable Inputs: Cells highlighted in yellow for modifying revenue growth, tax rates, and discount rates.
- Financial Statements: Detailed annual and quarterly financial reports for in-depth analysis.
- Key Ratios: Profitability, leverage, and efficiency ratios to assess performance.
- Dashboard and Charts: Visual representations of valuation results and underlying assumptions.
Disclaimer
All information, articles, and product details provided on this website are for general informational and educational purposes only. We do not claim any ownership over, nor do we intend to infringe upon, any trademarks, copyrights, logos, brand names, or other intellectual property mentioned or depicted on this site. Such intellectual property remains the property of its respective owners, and any references here are made solely for identification or informational purposes, without implying any affiliation, endorsement, or partnership.
We make no representations or warranties, express or implied, regarding the accuracy, completeness, or suitability of any content or products presented. Nothing on this website should be construed as legal, tax, investment, financial, medical, or other professional advice. In addition, no part of this site—including articles or product references—constitutes a solicitation, recommendation, endorsement, advertisement, or offer to buy or sell any securities, franchises, or other financial instruments, particularly in jurisdictions where such activity would be unlawful.
All content is of a general nature and may not address the specific circumstances of any individual or entity. It is not a substitute for professional advice or services. Any actions you take based on the information provided here are strictly at your own risk. You accept full responsibility for any decisions or outcomes arising from your use of this website and agree to release us from any liability in connection with your use of, or reliance upon, the content or products found herein.