
|
AC Immune SA (ACIU) Évaluation DCF |
Entièrement Modifiable: Adapté À Vos Besoins Dans Excel Ou Sheets
Conception Professionnelle: Modèles Fiables Et Conformes Aux Normes Du Secteur
Pré-Construits Pour Une Utilisation Rapide Et Efficace
Compatible MAC/PC, entièrement débloqué
Aucune Expertise N'Est Requise; Facile À Suivre
AC Immune SA (ACIU) Bundle
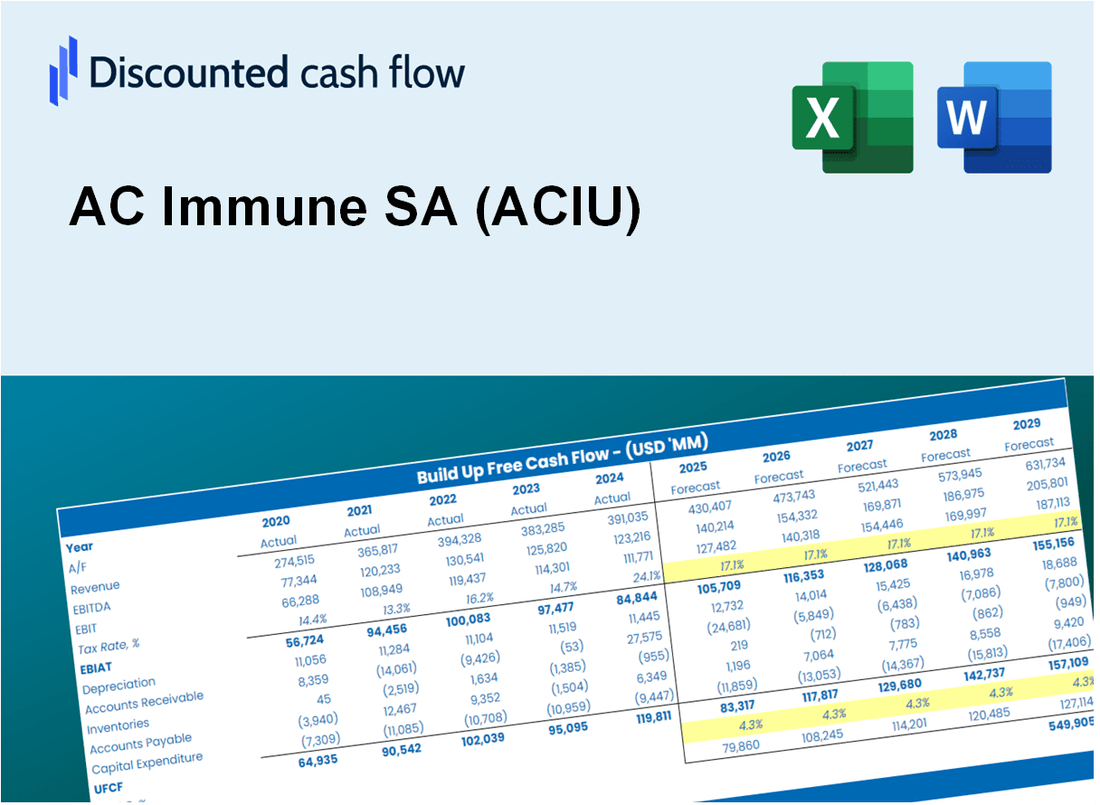
Explorez l'avenir financier d'AC Immune SA (ACIU) avec notre calculatrice DCF conviviale! Entrez vos hypothèses pour la croissance, les marges et les coûts pour calculer la valeur intrinsèque de AC Immune SA (ACIU) et informer vos décisions d'investissement.
Discounted Cash Flow (DCF) - (USD MM)
| Year | AY1 2020 |
AY2 2021 |
AY3 2022 |
AY4 2023 |
AY5 2024 |
FY1 2025 |
FY2 2026 |
FY3 2027 |
FY4 2028 |
FY5 2029 |
|---|---|---|---|---|---|---|---|---|---|---|
| Revenue | 19.2 | .0 | 4.9 | 18.4 | 34.0 | 41.2 | 49.8 | 60.4 | 73.1 | 88.6 |
| Revenue Growth, % | 0 | -100 | 0 | 276.14 | 84.51 | 21.13 | 21.13 | 21.13 | 21.13 | 21.13 |
| EBITDA | -74.4 | -87.1 | -84.6 | -64.5 | -60.5 | -24.7 | -29.9 | -36.2 | -43.9 | -53.2 |
| EBITDA, % | -387.34 | 100 | -1728.74 | -350.19 | -178.03 | -60 | -60 | -60 | -60 | -60 |
| Depreciation | 2.4 | 3.0 | 2.9 | 2.8 | 2.7 | 16.1 | 19.5 | 23.6 | 28.6 | 34.7 |
| Depreciation, % | 12.75 | 100 | 59.95 | 14.97 | 7.92 | 39.12 | 39.12 | 39.12 | 39.12 | 39.12 |
| EBIT | -76.8 | -90.1 | -87.6 | -67.2 | -63.2 | -24.7 | -29.9 | -36.2 | -43.9 | -53.2 |
| EBIT, % | -400.08 | 100 | -1788.69 | -365.16 | -185.95 | -60 | -60 | -60 | -60 | -60 |
| Total Cash | 281.0 | 246.6 | 152.5 | 128.2 | 205.9 | 41.2 | 49.8 | 60.4 | 73.1 | 88.6 |
| Total Cash, percent | .0 | .0 | .0 | .0 | .0 | .0 | .0 | .0 | .0 | .0 |
| Account Receivables | 2.0 | 1.2 | .5 | 18.7 | 1.4 | 18.5 | 22.4 | 27.1 | 32.9 | 39.8 |
| Account Receivables, % | 10.31 | 100 | 10.37 | 101.66 | 4.02 | 44.94 | 44.94 | 44.94 | 44.94 | 44.94 |
| Inventories | .0 | .0 | .0 | .0 | .0 | 8.2 | 10.0 | 12.1 | 14.6 | 17.7 |
| Inventories, % | 0 | 100 | 0 | 0 | 0 | 20 | 20 | 20 | 20 | 20 |
| Accounts Payable | 2.7 | 2.5 | 1.2 | 2.1 | 3.3 | 13.1 | 15.8 | 19.2 | 23.2 | 28.1 |
| Accounts Payable, % | 14.15 | 100 | 23.61 | 11.34 | 9.73 | 31.77 | 31.77 | 31.77 | 31.77 | 31.77 |
| Capital Expenditure | -2.1 | -3.3 | -1.5 | -1.0 | -.7 | -4.1 | -5.0 | -6.0 | -7.3 | -8.9 |
| Capital Expenditure, % | -11.06 | 100 | -31.49 | -5.41 | -2.11 | -10.01 | -10.01 | -10.01 | -10.01 | -10.01 |
| Tax Rate, % | -0.0058924 | -0.0058924 | -0.0058924 | -0.0058924 | -0.0058924 | -0.0058924 | -0.0058924 | -0.0058924 | -0.0058924 | -0.0058924 |
| EBITAT | -77.0 | -90.1 | -87.6 | -67.3 | -63.2 | -24.7 | -29.9 | -36.2 | -43.9 | -53.2 |
| Depreciation | ||||||||||
| Changes in Account Receivables | ||||||||||
| Changes in Inventories | ||||||||||
| Changes in Accounts Payable | ||||||||||
| Capital Expenditure | ||||||||||
| UFCF | -76.0 | -89.8 | -86.8 | -82.8 | -42.6 | -28.3 | -18.3 | -22.1 | -26.8 | -32.5 |
| WACC, % | 11.1 | 11.1 | 11.1 | 11.1 | 11.1 | 11.1 | 11.1 | 11.1 | 11.1 | 11.1 |
| PV UFCF | ||||||||||
| SUM PV UFCF | -93.3 | |||||||||
| Long Term Growth Rate, % | 2.00 | |||||||||
| Free cash flow (T + 1) | -33 | |||||||||
| Terminal Value | -364 | |||||||||
| Present Terminal Value | -215 | |||||||||
| Enterprise Value | -309 | |||||||||
| Net Debt | -38 | |||||||||
| Equity Value | -270 | |||||||||
| Diluted Shares Outstanding, MM | 100 | |||||||||
| Equity Value Per Share | -2.71 |
What You Will Get
- Real AC Immune Data: Preloaded financials – from revenue to EBIT – based on actual and projected figures for AC Immune SA (ACIU).
- Full Customization: Adjust all critical parameters (yellow cells) like WACC, growth %, and tax rates specific to AC Immune SA (ACIU).
- Instant Valuation Updates: Automatic recalculations to analyze the impact of changes on AC Immune SA (ACIU)'s fair value.
- Versatile Excel Template: Tailored for quick edits, scenario testing, and detailed projections for AC Immune SA (ACIU).
- Time-Saving and Accurate: Skip building models from scratch while maintaining precision and flexibility for AC Immune SA (ACIU).
Key Features
- Comprehensive Financial Data: Gain access to reliable pre-loaded historical figures and future forecasts for AC Immune SA (ACIU).
- Adjustable Projection Parameters: Modify highlighted cells for metrics like WACC, growth rates, and profit margins.
- Real-Time Calculations: Automatic updates for DCF, Net Present Value (NPV), and cash flow assessments.
- User-Friendly Dashboard: Intuitive charts and summaries to help visualize your valuation outcomes.
- Suitable for All Levels: Designed for investors, CFOs, and consultants with a straightforward, easy-to-navigate layout.
How It Works
- Step 1: Download the prebuilt Excel template featuring AC Immune SA’s (ACIU) data.
- Step 2: Navigate through the pre-filled sheets to familiarize yourself with the essential metrics.
- Step 3: Modify forecasts and assumptions in the editable yellow cells (WACC, growth, margins).
- Step 4: Instantly see the recalculated results, including AC Immune SA’s (ACIU) intrinsic value.
- Step 5: Use the outputs to make informed investment decisions or create detailed reports.
Why Choose This Calculator for AC Immune SA (ACIU)?
- Accuracy: Utilizes real AC Immune financials to ensure precise data.
- Flexibility: Tailored for users to easily test and adjust inputs as needed.
- Time-Saving: Avoid the complexities of constructing a DCF model from the ground up.
- Professional-Grade: Crafted with the precision and usability expected by CFOs.
- User-Friendly: Intuitive interface suitable for users without extensive financial modeling skills.
Who Should Use This Product?
- Investors: Accurately assess AC Immune SA’s (ACIU) fair value prior to making investment choices.
- CFOs: Utilize a professional-grade DCF model for financial reporting and analysis specific to AC Immune SA (ACIU).
- Consultants: Efficiently modify the template for valuation reports tailored to AC Immune SA (ACIU) clients.
- Entrepreneurs: Acquire insights into financial modeling practices employed by leading biotech firms like AC Immune SA (ACIU).
- Educators: Implement it as a teaching resource to illustrate valuation techniques relevant to AC Immune SA (ACIU).
What the Template Contains
- Pre-Filled DCF Model: AC Immune SA’s (ACIU) financial data preloaded for immediate use.
- WACC Calculator: Detailed calculations for Weighted Average Cost of Capital.
- Financial Ratios: Evaluate AC Immune SA’s profitability, leverage, and efficiency.
- Editable Inputs: Change assumptions such as growth, margins, and CAPEX to fit your scenarios.
- Financial Statements: Annual and quarterly reports to support detailed analysis.
- Interactive Dashboard: Easily visualize key valuation metrics and results.
Disclaimer
All information, articles, and product details provided on this website are for general informational and educational purposes only. We do not claim any ownership over, nor do we intend to infringe upon, any trademarks, copyrights, logos, brand names, or other intellectual property mentioned or depicted on this site. Such intellectual property remains the property of its respective owners, and any references here are made solely for identification or informational purposes, without implying any affiliation, endorsement, or partnership.
We make no representations or warranties, express or implied, regarding the accuracy, completeness, or suitability of any content or products presented. Nothing on this website should be construed as legal, tax, investment, financial, medical, or other professional advice. In addition, no part of this site—including articles or product references—constitutes a solicitation, recommendation, endorsement, advertisement, or offer to buy or sell any securities, franchises, or other financial instruments, particularly in jurisdictions where such activity would be unlawful.
All content is of a general nature and may not address the specific circumstances of any individual or entity. It is not a substitute for professional advice or services. Any actions you take based on the information provided here are strictly at your own risk. You accept full responsibility for any decisions or outcomes arising from your use of this website and agree to release us from any liability in connection with your use of, or reliance upon, the content or products found herein.