
|
Alvotech (Alvo) Évaluation DCF |
Entièrement Modifiable: Adapté À Vos Besoins Dans Excel Ou Sheets
Conception Professionnelle: Modèles Fiables Et Conformes Aux Normes Du Secteur
Pré-Construits Pour Une Utilisation Rapide Et Efficace
Compatible MAC/PC, entièrement débloqué
Aucune Expertise N'Est Requise; Facile À Suivre
Alvotech (ALVO) Bundle
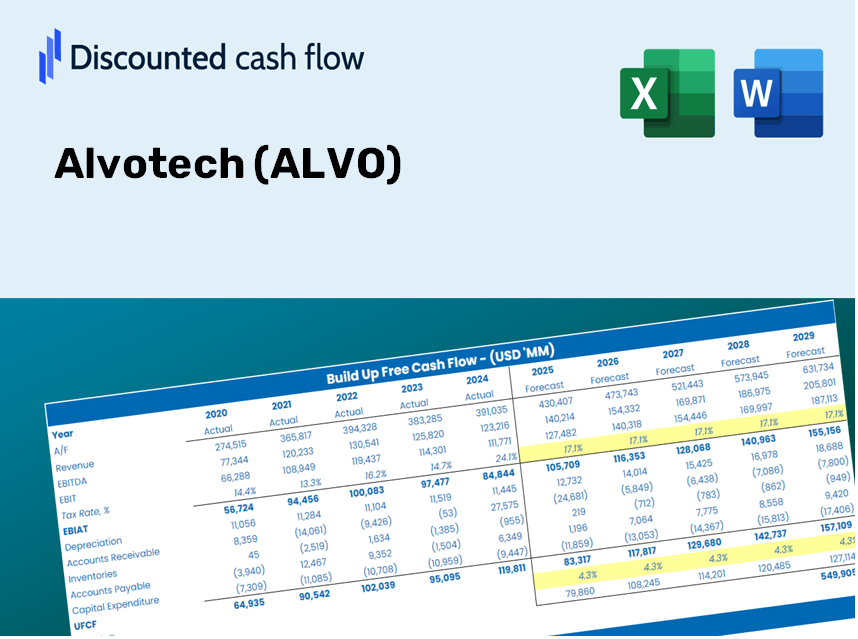
Évaluez les perspectives financières d'Alvotech (Alvo) comme un expert! Cette calculatrice (Alvo) DCF fournit des données financières pré-remplies et la flexibilité pour modifier la croissance des revenus, le WACC, les marges et autres hypothèses essentielles pour s'aligner sur vos prévisions.
Discounted Cash Flow (DCF) - (USD MM)
| Year | AY1 2020 |
AY2 2021 |
AY3 2022 |
AY4 2023 |
AY5 2024 |
FY1 2025 |
FY2 2026 |
FY3 2027 |
FY4 2028 |
FY5 2029 |
|---|---|---|---|---|---|---|---|---|---|---|
| Revenue | 66.6 | 36.8 | 83.0 | 91.4 | 489.7 | 692.1 | 978.1 | 1,382.4 | 1,953.7 | 2,761.2 |
| Revenue Growth, % | 0 | -44.8 | 125.79 | 10.12 | 435.56 | 41.33 | 41.33 | 41.33 | 41.33 | 41.33 |
| EBITDA | -125.7 | 4.0 | -439.8 | -484.9 | -28.7 | -408.3 | -577.1 | -815.6 | -1,152.7 | -1,629.1 |
| EBITDA, % | -188.65 | 10.86 | -529.69 | -530.29 | -5.85 | -59 | -59 | -59 | -59 | -59 |
| Depreciation | 16.4 | 18.2 | 20.4 | 24.2 | 31.3 | 182.1 | 257.4 | 363.8 | 514.1 | 726.6 |
| Depreciation, % | 24.65 | 49.48 | 24.58 | 26.48 | 6.39 | 26.32 | 26.32 | 26.32 | 26.32 | 26.32 |
| EBIT | -142.1 | -14.2 | -460.2 | -509.1 | -60.0 | -485.7 | -686.4 | -970.1 | -1,371.0 | -1,937.6 |
| EBIT, % | -213.3 | -38.62 | -554.28 | -556.76 | -12.25 | -70.17 | -70.17 | -70.17 | -70.17 | -70.17 |
| Total Cash | 31.7 | 17.6 | 66.4 | 11.2 | 51.4 | 274.1 | 387.4 | 547.5 | 773.8 | 1,093.6 |
| Total Cash, percent | .0 | .0 | .0 | .0 | .0 | .0 | .0 | .0 | .0 | .0 |
| Account Receivables | 38.9 | 53.9 | 71.4 | 87.2 | 251.7 | 541.4 | 765.2 | 1,081.5 | 1,528.5 | 2,160.2 |
| Account Receivables, % | 58.4 | 146.53 | 85.98 | 95.39 | 51.4 | 78.23 | 78.23 | 78.23 | 78.23 | 78.23 |
| Inventories | 9.6 | 39.1 | 71.5 | 74.4 | 127.9 | 426.4 | 602.7 | 851.8 | 1,203.8 | 1,701.3 |
| Inventories, % | 14.48 | 106.22 | 86.08 | 81.41 | 26.12 | 61.62 | 61.62 | 61.62 | 61.62 | 61.62 |
| Accounts Payable | 12.0 | 28.6 | 49.2 | 80.6 | 67.1 | 355.4 | 502.3 | 709.9 | 1,003.2 | 1,417.9 |
| Accounts Payable, % | 17.95 | 77.74 | 59.24 | 88.11 | 13.71 | 51.35 | 51.35 | 51.35 | 51.35 | 51.35 |
| Capital Expenditure | -12.0 | -40.6 | -49.0 | -46.5 | -57.0 | -331.5 | -468.5 | -662.1 | -935.7 | -1,322.5 |
| Capital Expenditure, % | -17.99 | -110.5 | -59.02 | -50.83 | -11.64 | -47.89 | -47.89 | -47.89 | -47.89 | -47.89 |
| Tax Rate, % | -6.57 | -6.57 | -6.57 | -6.57 | -6.57 | -6.57 | -6.57 | -6.57 | -6.57 | -6.57 |
| EBITAT | -82.8 | -9.7 | -428.5 | -431.4 | -63.9 | -392.6 | -554.8 | -784.1 | -1,108.2 | -1,566.2 |
| Depreciation | ||||||||||
| Changes in Account Receivables | ||||||||||
| Changes in Inventories | ||||||||||
| Changes in Accounts Payable | ||||||||||
| Capital Expenditure | ||||||||||
| UFCF | -115.0 | -59.9 | -486.4 | -441.1 | -321.0 | -841.9 | -1,019.0 | -1,440.2 | -2,035.4 | -2,876.7 |
| WACC, % | 5.61 | 6.04 | 7.16 | 6.79 | 7.47 | 6.62 | 6.62 | 6.62 | 6.62 | 6.62 |
| PV UFCF | ||||||||||
| SUM PV UFCF | -6,538.0 | |||||||||
| Long Term Growth Rate, % | 2.00 | |||||||||
| Free cash flow (T + 1) | -2,934 | |||||||||
| Terminal Value | -63,564 | |||||||||
| Present Terminal Value | -46,142 | |||||||||
| Enterprise Value | -52,680 | |||||||||
| Net Debt | 1,139 | |||||||||
| Equity Value | -53,819 | |||||||||
| Diluted Shares Outstanding, MM | 268 | |||||||||
| Equity Value Per Share | -200.87 |
What You Can Expect
- Genuine Alvotech Data: Comprehensive financials – from revenue to EBIT – based on both actual performance and future projections.
- Complete Customization: Modify all essential parameters (yellow cells) such as WACC, growth %, and tax rates to fit your analysis.
- Instant Valuation Adjustments: Real-time recalculations to evaluate how changes affect Alvotech's fair value.
- Flexible Excel Template: Designed for quick modifications, scenario analysis, and in-depth forecasting.
- Efficient and Reliable: Avoid the hassle of building models from scratch while ensuring accuracy and adaptability.
Key Features
- Comprehensive DCF Calculator: Offers both unlevered and levered DCF valuation models tailored for Alvotech (ALVO).
- WACC Calculator: Ready-to-use Weighted Average Cost of Capital template with adjustable inputs.
- Customizable Forecast Assumptions: Adjust growth rates, capital expenditures, and discount rates to fit your analysis.
- Integrated Financial Ratios: Evaluate profitability, leverage, and efficiency ratios specifically for Alvotech (ALVO).
- Interactive Dashboard and Charts: Visual representations that summarize essential valuation metrics for straightforward analysis.
How It Functions
- Step 1: Download the Excel spreadsheet.
- Step 2: Review Alvotech’s pre-filled financial data and projections.
- Step 3: Adjust key inputs, such as revenue growth, WACC, and tax rates (highlighted cells).
- Step 4: Observe the DCF model update in real-time as you modify assumptions.
- Step 5: Evaluate the results and apply the findings for investment decisions regarding Alvotech (ALVO).
Why Choose This Calculator for Alvotech (ALVO)?
- Accurate Data: Utilize real Alvotech financials for dependable valuation outcomes.
- Customizable: Modify essential parameters such as growth rates, WACC, and tax rates to align with your forecasts.
- Time-Saving: Pre-configured calculations save you the hassle of starting from the ground up.
- Professional-Grade Tool: Tailored for investors, analysts, and consultants in the biotech sector.
- User-Friendly: An intuitive design and step-by-step guidance ensure ease of use for everyone.
Who Can Benefit from This Product?
- Professional Investors: Develop comprehensive and trustworthy valuation models for portfolio evaluations.
- Corporate Finance Teams: Assess valuation scenarios to inform internal strategic decisions.
- Consultants and Advisors: Deliver precise valuation insights for Alvotech (ALVO) to clients.
- Students and Educators: Utilize real-world data to enhance financial modeling skills in teaching and learning environments.
- Biotech Enthusiasts: Gain insights into the market valuations of biotech firms like Alvotech (ALVO).
Components of the Template
- Pre-Populated Data: Features Alvotech’s historical financial data and projections.
- Discounted Cash Flow Model: An editable DCF valuation model with automated calculations.
- Weighted Average Cost of Capital (WACC): A dedicated section for calculating WACC using customizable inputs.
- Key Financial Ratios: Evaluate Alvotech’s profitability, operational efficiency, and financial leverage.
- Customizable Inputs: Effortlessly modify revenue growth rates, profit margins, and tax assumptions.
- User-Friendly Dashboard: Visualizations and tables that summarize essential valuation outcomes.
Disclaimer
All information, articles, and product details provided on this website are for general informational and educational purposes only. We do not claim any ownership over, nor do we intend to infringe upon, any trademarks, copyrights, logos, brand names, or other intellectual property mentioned or depicted on this site. Such intellectual property remains the property of its respective owners, and any references here are made solely for identification or informational purposes, without implying any affiliation, endorsement, or partnership.
We make no representations or warranties, express or implied, regarding the accuracy, completeness, or suitability of any content or products presented. Nothing on this website should be construed as legal, tax, investment, financial, medical, or other professional advice. In addition, no part of this site—including articles or product references—constitutes a solicitation, recommendation, endorsement, advertisement, or offer to buy or sell any securities, franchises, or other financial instruments, particularly in jurisdictions where such activity would be unlawful.
All content is of a general nature and may not address the specific circumstances of any individual or entity. It is not a substitute for professional advice or services. Any actions you take based on the information provided here are strictly at your own risk. You accept full responsibility for any decisions or outcomes arising from your use of this website and agree to release us from any liability in connection with your use of, or reliance upon, the content or products found herein.