
|
Amcor Plc (AMCR) Valation DCF |
Entièrement Modifiable: Adapté À Vos Besoins Dans Excel Ou Sheets
Conception Professionnelle: Modèles Fiables Et Conformes Aux Normes Du Secteur
Pré-Construits Pour Une Utilisation Rapide Et Efficace
Compatible MAC/PC, entièrement débloqué
Aucune Expertise N'Est Requise; Facile À Suivre
Amcor plc (AMCR) Bundle
Optimisez votre temps et augmentez la précision avec notre calculatrice (AMCR) DCF! En utilisant des données réelles Amcor PLC et des hypothèses personnalisables, cet outil vous permet de prévoir, analyser et valoriser Amcor PLC comme un investisseur chevronné.
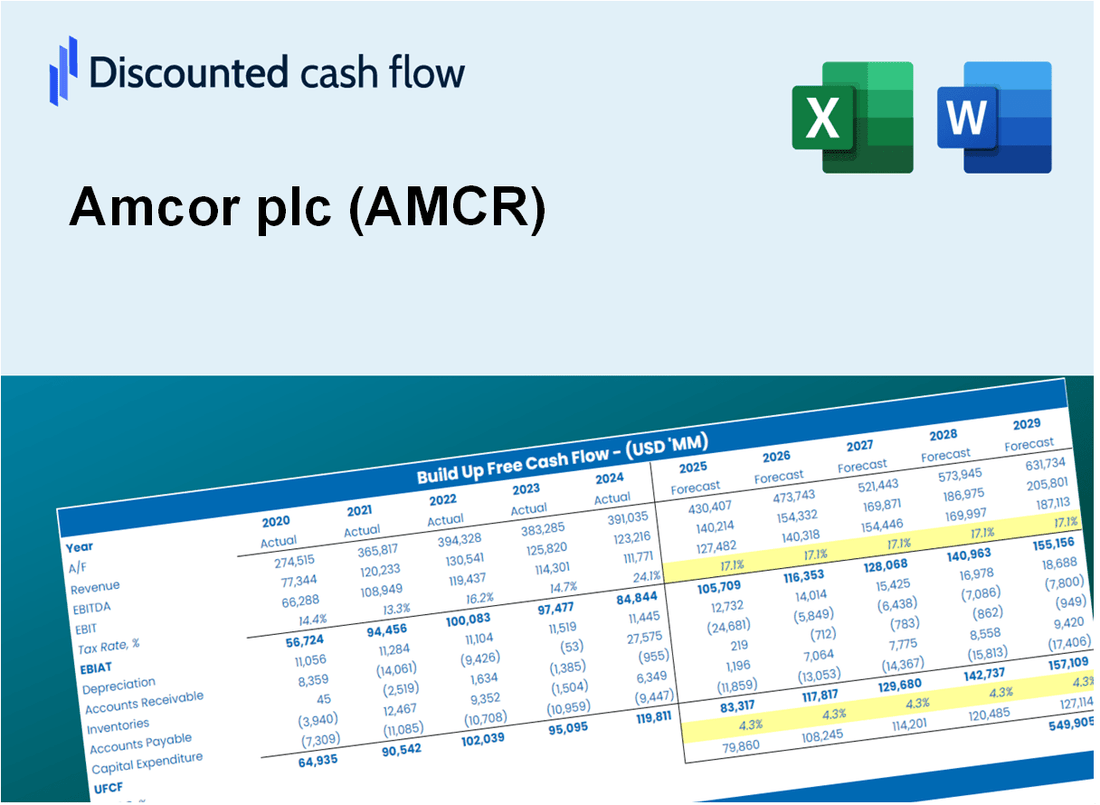
Discounted Cash Flow (DCF) - (USD MM)
| Year | AY1 2021 |
AY2 2022 |
AY3 2023 |
AY4 2024 |
AY5 2025 |
FY1 2026 |
FY2 2027 |
FY3 2028 |
FY4 2029 |
FY5 2030 |
|---|---|---|---|---|---|---|---|---|---|---|
| Revenue | 12,861.0 | 14,544.0 | 14,694.0 | 13,640.0 | 15,009.0 | 15,646.2 | 16,310.4 | 17,002.8 | 17,724.6 | 18,477.1 |
| Revenue Growth, % | 0 | 13.09 | 1.03 | -7.17 | 10.04 | 4.25 | 4.25 | 4.25 | 4.25 | 4.25 |
| EBITDA | 1,920.0 | 1,899.0 | 2,127.0 | 1,850.0 | 1,768.0 | 2,121.7 | 2,211.8 | 2,305.7 | 2,403.6 | 2,505.6 |
| EBITDA, % | 14.93 | 13.06 | 14.48 | 13.56 | 11.78 | 13.56 | 13.56 | 13.56 | 13.56 | 13.56 |
| Depreciation | 574.0 | 625.0 | 586.0 | 595.0 | 722.0 | 686.0 | 715.1 | 745.4 | 777.1 | 810.1 |
| Depreciation, % | 4.46 | 4.3 | 3.99 | 4.36 | 4.81 | 4.38 | 4.38 | 4.38 | 4.38 | 4.38 |
| EBIT | 1,346.0 | 1,274.0 | 1,541.0 | 1,255.0 | 1,046.0 | 1,435.8 | 1,496.7 | 1,560.3 | 1,626.5 | 1,695.6 |
| EBIT, % | 10.47 | 8.76 | 10.49 | 9.2 | 6.97 | 9.18 | 9.18 | 9.18 | 9.18 | 9.18 |
| Total Cash | 850.0 | 775.0 | 689.0 | 588.0 | 827.0 | 827.6 | 862.7 | 899.4 | 937.5 | 977.4 |
| Total Cash, percent | .0 | .0 | .0 | .0 | .0 | .0 | .0 | .0 | .0 | .0 |
| Account Receivables | 1,864.0 | 1,935.0 | 1,875.0 | 1,846.0 | 3,426.0 | 2,407.0 | 2,509.1 | 2,615.7 | 2,726.7 | 2,842.5 |
| Account Receivables, % | 14.49 | 13.3 | 12.76 | 13.53 | 22.83 | 15.38 | 15.38 | 15.38 | 15.38 | 15.38 |
| Inventories | 1,991.0 | 2,439.0 | 2,213.0 | 2,031.0 | 3,471.0 | 2,670.1 | 2,783.4 | 2,901.6 | 3,024.8 | 3,153.2 |
| Inventories, % | 15.48 | 16.77 | 15.06 | 14.89 | 23.13 | 17.07 | 17.07 | 17.07 | 17.07 | 17.07 |
| Accounts Payable | 2,574.0 | 3,073.0 | 2,690.0 | 2,580.0 | 3,490.0 | 3,179.8 | 3,314.8 | 3,455.6 | 3,602.3 | 3,755.2 |
| Accounts Payable, % | 20.01 | 21.13 | 18.31 | 18.91 | 23.25 | 20.32 | 20.32 | 20.32 | 20.32 | 20.32 |
| Capital Expenditure | -468.0 | -527.0 | -526.0 | -492.0 | -580.0 | -573.1 | -597.4 | -622.8 | -649.2 | -676.8 |
| Capital Expenditure, % | -3.64 | -3.62 | -3.58 | -3.61 | -3.86 | -3.66 | -3.66 | -3.66 | -3.66 | -3.66 |
| Tax Rate, % | 21.75 | 21.75 | 21.75 | 21.75 | 21.75 | 21.75 | 21.75 | 21.75 | 21.75 | 21.75 |
| EBITAT | 1,042.8 | 919.8 | 1,290.9 | 1,014.6 | 818.5 | 1,127.2 | 1,175.1 | 1,224.9 | 1,276.9 | 1,331.2 |
| Depreciation | ||||||||||
| Changes in Account Receivables | ||||||||||
| Changes in Inventories | ||||||||||
| Changes in Accounts Payable | ||||||||||
| Capital Expenditure | ||||||||||
| UFCF | -132.2 | 997.8 | 1,253.9 | 1,218.6 | -1,149.5 | 2,749.9 | 1,212.2 | 1,263.7 | 1,317.3 | 1,373.2 |
| WACC, % | 4.84 | 4.73 | 4.96 | 4.9 | 4.85 | 4.86 | 4.86 | 4.86 | 4.86 | 4.86 |
| PV UFCF | ||||||||||
| SUM PV UFCF | 6,994.0 | |||||||||
| Long Term Growth Rate, % | 2.00 | |||||||||
| Free cash flow (T + 1) | 1,401 | |||||||||
| Terminal Value | 49,018 | |||||||||
| Present Terminal Value | 38,668 | |||||||||
| Enterprise Value | 45,662 | |||||||||
| Net Debt | 14,181 | |||||||||
| Equity Value | 31,481 | |||||||||
| Diluted Shares Outstanding, MM | 1,593 | |||||||||
| Equity Value Per Share | 19.76 |
What You Will Get
- Real AMCR Financials: Access to historical and projected data for precise valuation.
- Adjustable Inputs: Customize WACC, tax rates, revenue growth, and capital expenditures.
- Automatic Calculations: Intrinsic value and NPV are computed in real-time.
- Scenario Analysis: Evaluate various scenarios to assess Amcor’s future performance.
- Clear and Intuitive Design: Designed for professionals while remaining user-friendly for novices.
Key Features
- Comprehensive DCF Calculator: Offers both unlevered and levered DCF valuation models tailored for Amcor plc (AMCR).
- WACC Analysis Tool: Features a pre-configured Weighted Average Cost of Capital sheet with adjustable parameters.
- Customizable Forecast Inputs: Easily adjust growth projections, capital expenditures, and discount rates.
- Integrated Financial Ratios: Evaluate profitability, leverage, and efficiency metrics specific to Amcor plc (AMCR).
- Interactive Dashboard and Visuals: Graphical representations highlight essential valuation metrics for streamlined analysis.
How It Works
- Step 1: Download the Excel file for Amcor plc (AMCR).
- Step 2: Review Amcor’s pre-filled financial data and projections.
- Step 3: Adjust key inputs such as revenue growth, WACC, and tax rates (highlighted cells).
- Step 4: Observe the DCF model update in real-time as you modify assumptions.
- Step 5: Evaluate the outputs and leverage the results for investment decisions.
Why Choose This Calculator for Amcor plc (AMCR)?
- Accuracy: Utilizes real Amcor financial data for precise calculations.
- Flexibility: Allows users to easily adjust and test various input parameters.
- Time-Saving: Eliminate the need to create a DCF model from the ground up.
- Professional-Grade: Crafted with the expertise and standards expected by CFOs.
- User-Friendly: Intuitive design makes it accessible for users with varying levels of financial knowledge.
Who Should Use This Product?
- Individual Investors: Gain insights to make informed decisions regarding buying or selling Amcor plc (AMCR) stock.
- Financial Analysts: Enhance valuation processes with ready-to-use financial models specific to Amcor plc (AMCR).
- Consultants: Provide clients with accurate and swift valuation insights related to Amcor plc (AMCR).
- Business Owners: Learn how major companies like Amcor plc (AMCR) are valued to inform your own business strategies.
- Finance Students: Explore valuation techniques using real-world data and case studies involving Amcor plc (AMCR).
What the Template Contains
- Operating and Balance Sheet Data: Pre-filled Amcor plc historical data and forecasts, including revenue, EBITDA, EBIT, and capital expenditures.
- WACC Calculation: A dedicated sheet for Weighted Average Cost of Capital (WACC), including parameters like Beta, risk-free rate, and share price.
- DCF Valuation (Unlevered and Levered): Editable Discounted Cash Flow models showing intrinsic value with detailed calculations.
- Financial Statements: Pre-loaded financial statements (annual and quarterly) to support analysis.
- Key Ratios: Includes profitability, leverage, and efficiency ratios for Amcor plc.
- Dashboard and Charts: Visual summary of valuation outputs and assumptions to analyze results easily.
Disclaimer
All information, articles, and product details provided on this website are for general informational and educational purposes only. We do not claim any ownership over, nor do we intend to infringe upon, any trademarks, copyrights, logos, brand names, or other intellectual property mentioned or depicted on this site. Such intellectual property remains the property of its respective owners, and any references here are made solely for identification or informational purposes, without implying any affiliation, endorsement, or partnership.
We make no representations or warranties, express or implied, regarding the accuracy, completeness, or suitability of any content or products presented. Nothing on this website should be construed as legal, tax, investment, financial, medical, or other professional advice. In addition, no part of this site—including articles or product references—constitutes a solicitation, recommendation, endorsement, advertisement, or offer to buy or sell any securities, franchises, or other financial instruments, particularly in jurisdictions where such activity would be unlawful.
All content is of a general nature and may not address the specific circumstances of any individual or entity. It is not a substitute for professional advice or services. Any actions you take based on the information provided here are strictly at your own risk. You accept full responsibility for any decisions or outcomes arising from your use of this website and agree to release us from any liability in connection with your use of, or reliance upon, the content or products found herein.