
|
AMI Organics Limited (Amiorg.NS) Évaluation DCF |
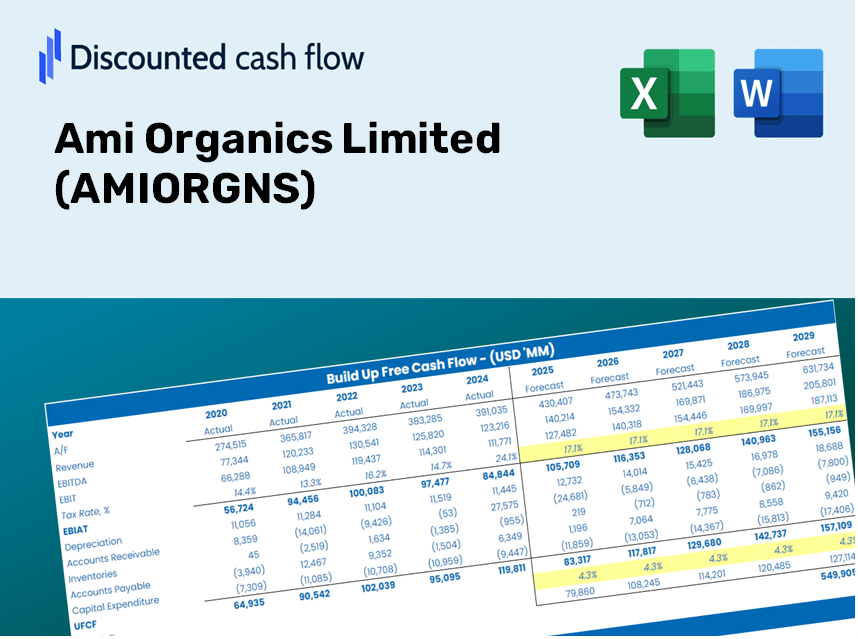
Entièrement Modifiable: Adapté À Vos Besoins Dans Excel Ou Sheets
Conception Professionnelle: Modèles Fiables Et Conformes Aux Normes Du Secteur
Pré-Construits Pour Une Utilisation Rapide Et Efficace
Compatible MAC/PC, entièrement débloqué
Aucune Expertise N'Est Requise; Facile À Suivre
Ami Organics Limited (AMIORG.NS) Bundle
Évaluez les perspectives financières d'AMI Organics Limited comme un pro! Cette calculatrice (Amiorgns) DCF fournit des données financières pré-remplies tout en vous permettant la flexibilité de modifier la croissance des revenus, le WACC, les marges et d'autres hypothèses essentielles pour s'aligner sur vos prévisions.
Discounted Cash Flow (DCF) - (USD MM)
| Year | AY1 2021 |
AY2 2022 |
AY3 2023 |
AY4 2024 |
AY5 2025 |
FY1 2026 |
FY2 2027 |
FY3 2028 |
FY4 2029 |
FY5 2030 |
|---|---|---|---|---|---|---|---|---|---|---|
| Revenue | 3,406.1 | 5,181.9 | 6,167.3 | 7,174.7 | 10,068.8 | 13,286.3 | 17,532.1 | 23,134.7 | 30,527.6 | 40,283.0 |
| Revenue Growth, % | 0 | 52.14 | 19.02 | 16.33 | 40.34 | 31.96 | 31.96 | 31.96 | 31.96 | 31.96 |
| EBITDA | 811.1 | 1,075.8 | 1,269.3 | 1,039.0 | 2,320.7 | 2,728.6 | 3,600.6 | 4,751.2 | 6,269.4 | 8,272.9 |
| EBITDA, % | 23.81 | 20.76 | 20.58 | 14.48 | 23.05 | 20.54 | 20.54 | 20.54 | 20.54 | 20.54 |
| Depreciation | 41.9 | 100.8 | 123.4 | 160.6 | 266.2 | 267.3 | 352.7 | 465.4 | 614.1 | 810.3 |
| Depreciation, % | 1.23 | 1.95 | 2 | 2.24 | 2.64 | 2.01 | 2.01 | 2.01 | 2.01 | 2.01 |
| EBIT | 769.3 | 975.0 | 1,145.8 | 878.4 | 2,054.5 | 2,461.3 | 3,247.9 | 4,285.8 | 5,655.4 | 7,462.6 |
| EBIT, % | 22.59 | 18.81 | 18.58 | 12.24 | 20.4 | 18.53 | 18.53 | 18.53 | 18.53 | 18.53 |
| Total Cash | 26.9 | 615.5 | 586.7 | 533.1 | 2,489.3 | 1,443.7 | 1,905.1 | 2,513.9 | 3,317.2 | 4,377.3 |
| Total Cash, percent | .0 | .0 | .0 | .0 | .0 | .0 | .0 | .0 | .0 | .0 |
| Account Receivables | 1,317.7 | .0 | 2,348.2 | .0 | 2,904.9 | 2,806.4 | 3,703.3 | 4,886.7 | 6,448.2 | 8,508.9 |
| Account Receivables, % | 38.69 | 0 | 38.07 | 0 | 28.85 | 21.12 | 21.12 | 21.12 | 21.12 | 21.12 |
| Inventories | 603.6 | 1,121.7 | 1,191.7 | 1,567.3 | 1,799.4 | 2,615.0 | 3,450.6 | 4,553.3 | 6,008.4 | 7,928.4 |
| Inventories, % | 17.72 | 21.65 | 19.32 | 21.85 | 17.87 | 19.68 | 19.68 | 19.68 | 19.68 | 19.68 |
| Accounts Payable | 847.8 | 1,184.2 | 1,420.5 | 1,346.1 | 1,560.5 | 2,791.0 | 3,682.9 | 4,859.8 | 6,412.8 | 8,462.1 |
| Accounts Payable, % | 24.89 | 22.85 | 23.03 | 18.76 | 15.5 | 21.01 | 21.01 | 21.01 | 21.01 | 21.01 |
| Capital Expenditure | -1,065.8 | -337.6 | -964.0 | -2,809.1 | -1,946.4 | -2,974.0 | -3,924.4 | -5,178.5 | -6,833.3 | -9,017.0 |
| Capital Expenditure, % | -31.29 | -6.51 | -15.63 | -39.15 | -19.33 | -22.38 | -22.38 | -22.38 | -22.38 | -22.38 |
| Tax Rate, % | 26.58 | 26.58 | 26.58 | 26.58 | 26.58 | 26.58 | 26.58 | 26.58 | 26.58 | 26.58 |
| EBITAT | 579.1 | 767.0 | 850.8 | 458.8 | 1,508.5 | 1,741.9 | 2,298.6 | 3,033.1 | 4,002.4 | 5,281.4 |
| Depreciation | ||||||||||
| Changes in Account Receivables | ||||||||||
| Changes in Inventories | ||||||||||
| Changes in Accounts Payable | ||||||||||
| Capital Expenditure | ||||||||||
| UFCF | -1,518.4 | 1,666.3 | -2,171.7 | -291.6 | -3,094.4 | -451.3 | -2,113.7 | -2,789.2 | -3,680.5 | -4,856.6 |
| WACC, % | 5.01 | 5.01 | 5.01 | 4.99 | 5.01 | 5 | 5 | 5 | 5 | 5 |
| PV UFCF | ||||||||||
| SUM PV UFCF | -11,588.1 | |||||||||
| Long Term Growth Rate, % | 4.00 | |||||||||
| Free cash flow (T + 1) | -5,051 | |||||||||
| Terminal Value | -503,162 | |||||||||
| Present Terminal Value | -394,168 | |||||||||
| Enterprise Value | -405,757 | |||||||||
| Net Debt | -2,360 | |||||||||
| Equity Value | -403,397 | |||||||||
| Diluted Shares Outstanding, MM | 80 | |||||||||
| Equity Value Per Share | -5,035.03 |
Benefits You Will Receive
- Customizable Excel Template: A versatile Excel-based DCF Calculator featuring pre-filled financial data for AMIORGNS.
- Accurate Data: Access to historical financials and projections (highlighted in the yellow cells).
- Flexible Forecasting: Adjust key assumptions such as revenue growth, EBITDA margin, and WACC at your discretion.
- Instant Calculations: Quickly observe how your inputs affect the valuation of Ami Organics Limited.
- Professional Resource: Designed for investors, CFOs, consultants, and financial analysts.
- User-Friendly Interface: Organized for optimal clarity and usability, complete with step-by-step guidance.
Key Features
- Real-Life AMIORGNS Data: Pre-filled with Ami Organics Limited’s historical financials and future projections.
- Fully Customizable Inputs: Modify revenue growth, profit margins, WACC, tax rates, and capital expenditures as needed.
- Dynamic Valuation Model: Automatic recalculations of Net Present Value (NPV) and intrinsic value based on your adjustments.
- Scenario Testing: Develop multiple forecast scenarios to evaluate various valuation results.
- User-Friendly Design: Intuitive and organized, catering to both professionals and newcomers.
How It Works
- Step 1: Download the Excel file.
- Step 2: Review the pre-entered data for Ami Organics Limited (AMIORGNS), including historical and projected figures.
- Step 3: Modify key assumptions (yellow cells) based on your own analysis.
- Step 4: Observe the automatic recalculations of Ami Organics Limited's (AMIORGNS) intrinsic value.
- Step 5: Utilize the results for your investment decisions or reporting needs.
Why Opt for This Calculator?
- Precision: Accurate financial data from Ami Organics Limited (AMIORGNS) ensures reliable results.
- Versatility: Tailored for users to easily adjust and experiment with various inputs.
- Efficiency: Avoid the complications of creating a DCF model from the ground up.
- Expert-Level: Crafted with the insight and usability expected from top financial executives.
- Intuitive: Simple to navigate, even for those lacking advanced financial modeling skills.
Who Can Benefit from Ami Organics Limited (AMIORGNS)?
- Professional Investors: Develop comprehensive and accurate valuation models for effective portfolio management.
- Corporate Finance Teams: Evaluate valuation scenarios to inform strategic decision-making.
- Consultants and Advisors: Deliver precise valuation insights for clients interested in Ami Organics Limited (AMIORGNS).
- Students and Educators: Utilize real-world data for practicing and teaching financial modeling techniques.
- Industry Enthusiasts: Gain insights into how companies like Ami Organics Limited (AMIORGNS) are assessed within the market.
What the Template Includes
- Preloaded AMIORGNS Data: Historical and projected financial figures, encompassing revenue, EBIT, and capital expenditures.
- DCF and WACC Models: Professional-grade spreadsheets designed for calculating intrinsic value and Weighted Average Cost of Capital.
- Editable Inputs: Yellow-highlighted fields for modifying revenue growth, tax rates, and discount rates.
- Financial Statements: Detailed annual and quarterly financial reports for thorough analysis.
- Key Ratios: Profitability, leverage, and efficiency ratios to assess performance.
- Dashboard and Charts: Visual representations of valuation results and assumptions.
Disclaimer
All information, articles, and product details provided on this website are for general informational and educational purposes only. We do not claim any ownership over, nor do we intend to infringe upon, any trademarks, copyrights, logos, brand names, or other intellectual property mentioned or depicted on this site. Such intellectual property remains the property of its respective owners, and any references here are made solely for identification or informational purposes, without implying any affiliation, endorsement, or partnership.
We make no representations or warranties, express or implied, regarding the accuracy, completeness, or suitability of any content or products presented. Nothing on this website should be construed as legal, tax, investment, financial, medical, or other professional advice. In addition, no part of this site—including articles or product references—constitutes a solicitation, recommendation, endorsement, advertisement, or offer to buy or sell any securities, franchises, or other financial instruments, particularly in jurisdictions where such activity would be unlawful.
All content is of a general nature and may not address the specific circumstances of any individual or entity. It is not a substitute for professional advice or services. Any actions you take based on the information provided here are strictly at your own risk. You accept full responsibility for any decisions or outcomes arising from your use of this website and agree to release us from any liability in connection with your use of, or reliance upon, the content or products found herein.