
|
Anaptysbio, Inc. (ANAB) Évaluation DCF |
Entièrement Modifiable: Adapté À Vos Besoins Dans Excel Ou Sheets
Conception Professionnelle: Modèles Fiables Et Conformes Aux Normes Du Secteur
Pré-Construits Pour Une Utilisation Rapide Et Efficace
Compatible MAC/PC, entièrement débloqué
Aucune Expertise N'Est Requise; Facile À Suivre
AnaptysBio, Inc. (ANAB) Bundle
Améliorez vos choix d'investissement avec la calculatrice DCF ANAPTYSBIO, Inc. (ANAB)! Explorez les finances ANAPTYSBIO authentiques, ajustez les projections et dépenses de croissance et observez instantanément comment ces modifications affectent la valeur intrinsèque d'Anaptysbio, Inc. (ANAB).
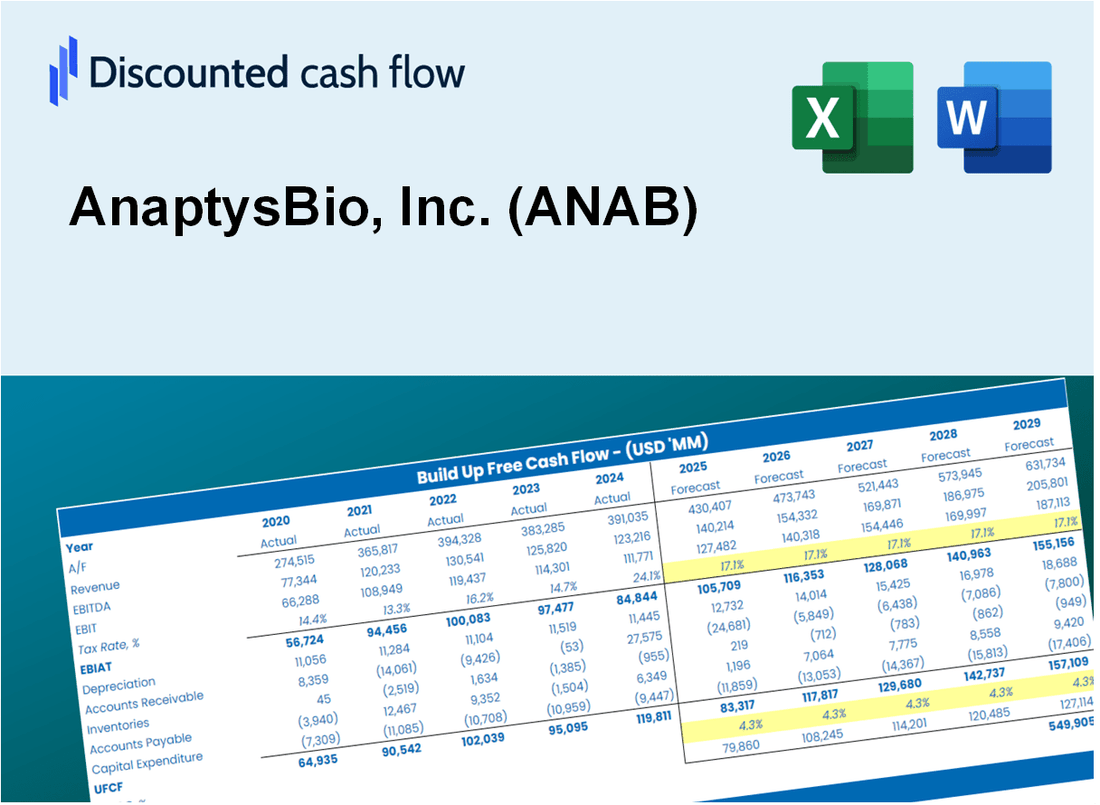
Discounted Cash Flow (DCF) - (USD MM)
| Year | AY1 2020 |
AY2 2021 |
AY3 2022 |
AY4 2023 |
AY5 2024 |
FY1 2025 |
FY2 2026 |
FY3 2027 |
FY4 2028 |
FY5 2029 |
|---|---|---|---|---|---|---|---|---|---|---|
| Revenue | 75.0 | 63.2 | 10.3 | 17.2 | 91.3 | 106.6 | 124.6 | 145.5 | 170.0 | 198.6 |
| Revenue Growth, % | 0 | -15.77 | -83.72 | 66.78 | 432.03 | 16.82 | 16.82 | 16.82 | 16.82 | 16.82 |
| EBITDA | -19.4 | -55.7 | -105.3 | -156.4 | -92.7 | -88.3 | -103.2 | -120.5 | -140.8 | -164.5 |
| EBITDA, % | -25.83 | -88.18 | -1023.2 | -911.7 | -101.6 | -82.8 | -82.8 | -82.8 | -82.8 | -82.8 |
| Depreciation | .6 | 2.1 | 2.3 | .7 | 2.4 | 7.1 | 8.3 | 9.7 | 11.3 | 13.2 |
| Depreciation, % | 0.74533 | 3.31 | 22.7 | 3.8 | 2.63 | 6.64 | 6.64 | 6.64 | 6.64 | 6.64 |
| EBIT | -19.9 | -57.8 | -107.6 | -157.1 | -95.1 | -89.2 | -104.2 | -121.7 | -142.2 | -166.1 |
| EBIT, % | -26.57 | -91.49 | -1045.9 | -915.5 | -104.23 | -83.61 | -83.61 | -83.61 | -83.61 | -83.61 |
| Total Cash | 393.7 | 548.1 | 441.2 | 390.9 | 385.4 | 106.6 | 124.6 | 145.5 | 170.0 | 198.6 |
| Total Cash, percent | .0 | .0 | .0 | .0 | .0 | .0 | .0 | .0 | .0 | .0 |
| Account Receivables | .0 | .9 | 1.4 | 6.9 | 40.8 | 21.3 | 24.9 | 29.0 | 33.9 | 39.6 |
| Account Receivables, % | 0 | 1.39 | 13.79 | 39.93 | 44.66 | 19.95 | 19.95 | 19.95 | 19.95 | 19.95 |
| Inventories | .0 | .0 | .0 | .0 | .0 | .0 | .0 | .0 | .0 | .0 |
| Inventories, % | 0 | 0 | 0 | 0 | 0 | 0 | 0 | 0 | 0 | 0 |
| Accounts Payable | 4.2 | 1.7 | 2.8 | 4.7 | 4.0 | 14.3 | 16.7 | 19.6 | 22.9 | 26.7 |
| Accounts Payable, % | 5.62 | 2.76 | 27.06 | 27.38 | 4.38 | 13.44 | 13.44 | 13.44 | 13.44 | 13.44 |
| Capital Expenditure | -.6 | -1.4 | -.4 | -.8 | -.4 | -2.5 | -2.9 | -3.3 | -3.9 | -4.6 |
| Capital Expenditure, % | -0.75867 | -2.16 | -3.48 | -4.7 | -0.3922 | -2.3 | -2.3 | -2.3 | -2.3 | -2.3 |
| Tax Rate, % | -0.00206572 | -0.00206572 | -0.00206572 | -0.00206572 | -0.00206572 | -0.00206572 | -0.00206572 | -0.00206572 | -0.00206572 | -0.00206572 |
| EBITAT | -19.9 | -57.8 | -107.6 | -157.1 | -95.1 | -89.2 | -104.2 | -121.7 | -142.2 | -166.1 |
| Depreciation | ||||||||||
| Changes in Account Receivables | ||||||||||
| Changes in Inventories | ||||||||||
| Changes in Accounts Payable | ||||||||||
| Capital Expenditure | ||||||||||
| UFCF | -15.7 | -60.4 | -105.1 | -160.7 | -127.7 | -54.7 | -99.9 | -116.7 | -136.4 | -159.3 |
| WACC, % | 7.5 | 7.5 | 7.5 | 7.5 | 7.5 | 7.5 | 7.5 | 7.5 | 7.5 | 7.5 |
| PV UFCF | ||||||||||
| SUM PV UFCF | -444.4 | |||||||||
| Long Term Growth Rate, % | 2.00 | |||||||||
| Free cash flow (T + 1) | -163 | |||||||||
| Terminal Value | -2,952 | |||||||||
| Present Terminal Value | -2,056 | |||||||||
| Enterprise Value | -2,501 | |||||||||
| Net Debt | 246 | |||||||||
| Equity Value | -2,747 | |||||||||
| Diluted Shares Outstanding, MM | 28 | |||||||||
| Equity Value Per Share | -96.78 |
What You Will Get
- Pre-Filled Financial Model: AnaptysBio’s actual data enables precise DCF valuation.
- Full Forecast Control: Adjust revenue growth, margins, WACC, and other key drivers.
- Instant Calculations: Automatic updates ensure you see results as you make changes.
- Investor-Ready Template: A refined Excel file designed for professional-grade valuation.
- Customizable and Reusable: Tailored for flexibility, allowing repeated use for detailed forecasts.
Key Features
- 🔍 Real-Life ANAB Financials: Pre-filled historical and projected data for AnaptysBio, Inc.
- ✏️ Fully Customizable Inputs: Adjust all critical parameters (yellow cells) like WACC, growth %, and tax rates.
- 📊 Professional DCF Valuation: Built-in formulas calculate AnaptysBio’s intrinsic value using the Discounted Cash Flow method.
- ⚡ Instant Results: Visualize AnaptysBio’s valuation instantly after making changes.
- Scenario Analysis: Test and compare outcomes for various financial assumptions side-by-side.
How It Works
- Download the Template: Gain immediate access to the Excel-based ANAB DCF Calculator.
- Input Your Assumptions: Modify the yellow-highlighted cells for growth rates, WACC, margins, and other variables.
- Instant Calculations: The model will automatically refresh to display AnaptysBio’s intrinsic value.
- Test Scenarios: Experiment with various assumptions to assess potential changes in valuation.
- Analyze and Decide: Utilize the results to inform your investment or financial assessment.
Why Choose This Calculator for AnaptysBio, Inc. (ANAB)?
- Comprehensive Tool: Integrates DCF, WACC, and financial ratio analyses tailored for AnaptysBio.
- Customizable Inputs: Modify yellow-highlighted fields to explore different financial scenarios for (ANAB).
- Detailed Insights: Automatically computes AnaptysBio’s intrinsic value and Net Present Value.
- Preloaded Data: Historical and projected data provide reliable starting points for analysis.
- Professional Quality: Perfect for financial analysts, investors, and consultants focusing on (ANAB).
Who Should Use AnaptysBio, Inc. (ANAB)?
- Biotech Students: Explore drug development processes and apply theoretical knowledge to real-world scenarios.
- Researchers: Utilize cutting-edge models for innovative studies in immunology and drug discovery.
- Investors: Evaluate your investment strategies and analyze market performance for AnaptysBio stock.
- Industry Analysts: Enhance your analysis with a customizable framework for assessing biotech companies.
- Healthcare Professionals: Understand how biotech firms like AnaptysBio are evaluated and the impact on patient care.
What the Template Contains
- Preloaded ANAB Data: Historical and projected financial data, including revenue, EBIT, and capital expenditures.
- DCF and WACC Models: Professional-grade sheets for calculating intrinsic value and Weighted Average Cost of Capital.
- Editable Inputs: Yellow-highlighted cells for adjusting revenue growth, tax rates, and discount rates.
- Financial Statements: Comprehensive annual and quarterly financials for deeper analysis.
- Key Ratios: Profitability, leverage, and efficiency ratios to evaluate performance.
- Dashboard and Charts: Visual summaries of valuation outcomes and assumptions.
Disclaimer
All information, articles, and product details provided on this website are for general informational and educational purposes only. We do not claim any ownership over, nor do we intend to infringe upon, any trademarks, copyrights, logos, brand names, or other intellectual property mentioned or depicted on this site. Such intellectual property remains the property of its respective owners, and any references here are made solely for identification or informational purposes, without implying any affiliation, endorsement, or partnership.
We make no representations or warranties, express or implied, regarding the accuracy, completeness, or suitability of any content or products presented. Nothing on this website should be construed as legal, tax, investment, financial, medical, or other professional advice. In addition, no part of this site—including articles or product references—constitutes a solicitation, recommendation, endorsement, advertisement, or offer to buy or sell any securities, franchises, or other financial instruments, particularly in jurisdictions where such activity would be unlawful.
All content is of a general nature and may not address the specific circumstances of any individual or entity. It is not a substitute for professional advice or services. Any actions you take based on the information provided here are strictly at your own risk. You accept full responsibility for any decisions or outcomes arising from your use of this website and agree to release us from any liability in connection with your use of, or reliance upon, the content or products found herein.