
|
Anupam Rasayan India Limited (Anuras.NS) Évaluation DCF |
Entièrement Modifiable: Adapté À Vos Besoins Dans Excel Ou Sheets
Conception Professionnelle: Modèles Fiables Et Conformes Aux Normes Du Secteur
Pré-Construits Pour Une Utilisation Rapide Et Efficace
Compatible MAC/PC, entièrement débloqué
Aucune Expertise N'Est Requise; Facile À Suivre
Anupam Rasayan India Limited (ANURAS.NS) Bundle
Simplifiez l'évaluation Anupam Rasayan India Limited (anurasns) avec cette calculatrice DCF personnalisable! Doté de véritables ANUPAM Rasayan India Limited (ANURASNS) Financials and Adjustable Prévision des intrants, vous pouvez tester les scénarios et découvrir la juste valeur d'Anupam Rasayan India Limited (ANURASNS) en minutes.
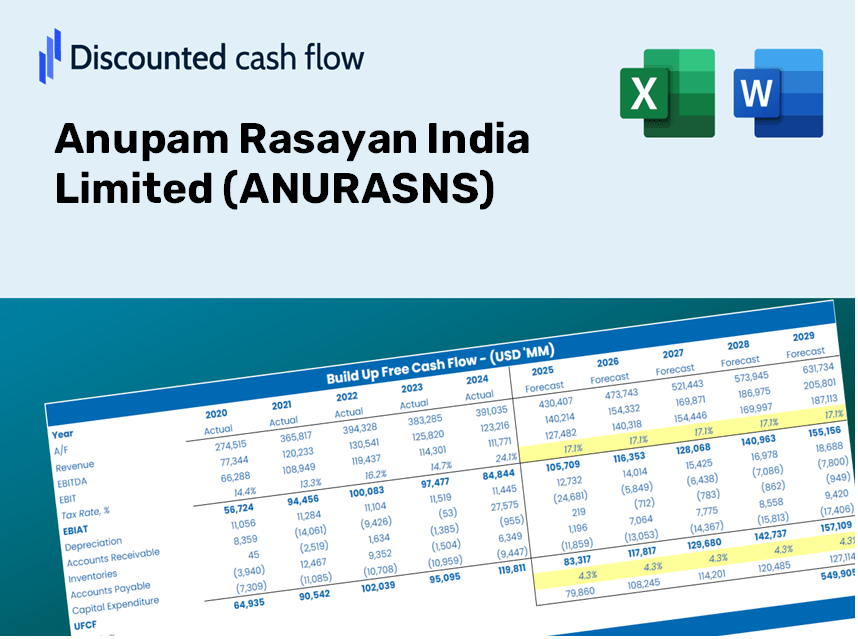
Discounted Cash Flow (DCF) - (USD MM)
| Year | AY1 2021 |
AY2 2022 |
AY3 2023 |
AY4 2024 |
AY5 2025 |
FY1 2026 |
FY2 2027 |
FY3 2028 |
FY4 2029 |
FY5 2030 |
|---|---|---|---|---|---|---|---|---|---|---|
| Revenue | 8,160.0 | 10,737.7 | 16,019.1 | 14,804.7 | 14,422.0 | 16,967.9 | 19,963.1 | 23,487.1 | 27,633.1 | 32,511.0 |
| Revenue Growth, % | 0 | 31.59 | 49.19 | -7.58 | -2.58 | 17.65 | 17.65 | 17.65 | 17.65 | 17.65 |
| EBITDA | 2,019.4 | 3,029.8 | 4,294.9 | 3,818.5 | 3,999.6 | 4,523.6 | 5,322.1 | 6,261.6 | 7,367.0 | 8,667.4 |
| EBITDA, % | 24.75 | 28.22 | 26.81 | 25.79 | 27.73 | 26.66 | 26.66 | 26.66 | 26.66 | 26.66 |
| Depreciation | 496.9 | 581.7 | 689.7 | 748.4 | 953.2 | 932.4 | 1,097.0 | 1,290.7 | 1,518.5 | 1,786.6 |
| Depreciation, % | 6.09 | 5.42 | 4.31 | 5.06 | 6.61 | 5.5 | 5.5 | 5.5 | 5.5 | 5.5 |
| EBIT | 1,522.5 | 2,448.1 | 3,605.2 | 3,070.0 | 3,046.5 | 3,591.2 | 4,225.1 | 4,970.9 | 5,848.4 | 6,880.8 |
| EBIT, % | 18.66 | 22.8 | 22.51 | 20.74 | 21.12 | 21.16 | 21.16 | 21.16 | 21.16 | 21.16 |
| Total Cash | 2,957.1 | 618.8 | 6,673.8 | 3,478.9 | 1,347.1 | 3,953.6 | 4,651.5 | 5,472.6 | 6,438.6 | 7,575.2 |
| Total Cash, percent | .0 | .0 | .0 | .0 | .0 | .0 | .0 | .0 | .0 | .0 |
| Account Receivables | 2,054.9 | 2,850.0 | 4,800.3 | 5,793.9 | 7,358.1 | 5,831.7 | 6,861.1 | 8,072.3 | 9,497.3 | 11,173.8 |
| Account Receivables, % | 25.18 | 26.54 | 29.97 | 39.14 | 51.02 | 34.37 | 34.37 | 34.37 | 34.37 | 34.37 |
| Inventories | 4,922.2 | 8,631.9 | 9,314.7 | 10,553.2 | 14,515.0 | 12,561.0 | 14,778.3 | 17,387.0 | 20,456.2 | 24,067.3 |
| Inventories, % | 60.32 | 80.39 | 58.15 | 71.28 | 100.64 | 74.03 | 74.03 | 74.03 | 74.03 | 74.03 |
| Accounts Payable | 1,996.3 | 1,851.3 | 1,814.9 | 4,151.9 | 5,763.8 | 4,107.7 | 4,832.8 | 5,685.9 | 6,689.7 | 7,870.5 |
| Accounts Payable, % | 24.46 | 17.24 | 11.33 | 28.04 | 39.96 | 24.21 | 24.21 | 24.21 | 24.21 | 24.21 |
| Capital Expenditure | -1,460.2 | -1,468.6 | -2,207.7 | -7,159.9 | -4,099.2 | -4,144.9 | -4,876.5 | -5,737.4 | -6,750.1 | -7,941.7 |
| Capital Expenditure, % | -17.89 | -13.68 | -13.78 | -48.36 | -28.42 | -24.43 | -24.43 | -24.43 | -24.43 | -24.43 |
| Tax Rate, % | 52.82 | 52.82 | 52.82 | 52.82 | 52.82 | 52.82 | 52.82 | 52.82 | 52.82 | 52.82 |
| EBITAT | 1,070.2 | 1,679.2 | 2,119.1 | 1,633.0 | 1,437.4 | 2,140.6 | 2,518.5 | 2,963.1 | 3,486.2 | 4,101.6 |
| Depreciation | ||||||||||
| Changes in Account Receivables | ||||||||||
| Changes in Inventories | ||||||||||
| Changes in Accounts Payable | ||||||||||
| Capital Expenditure | ||||||||||
| UFCF | -4,873.9 | -3,857.6 | -2,068.2 | -4,673.6 | -5,622.8 | 752.6 | -3,782.6 | -4,450.3 | -5,235.9 | -6,160.2 |
| WACC, % | 4.99 | 4.98 | 4.9 | 4.85 | 4.8 | 4.9 | 4.9 | 4.9 | 4.9 | 4.9 |
| PV UFCF | ||||||||||
| SUM PV UFCF | -15,747.4 | |||||||||
| Long Term Growth Rate, % | 4.00 | |||||||||
| Free cash flow (T + 1) | -6,407 | |||||||||
| Terminal Value | -709,326 | |||||||||
| Present Terminal Value | -558,345 | |||||||||
| Enterprise Value | -574,092 | |||||||||
| Net Debt | 12,457 | |||||||||
| Equity Value | -586,549 | |||||||||
| Diluted Shares Outstanding, MM | 110 | |||||||||
| Equity Value Per Share | -5,339.12 |
What You'll Receive
- Customizable Excel Template: A fully adjustable Excel-based DCF Calculator featuring pre-populated financial data for Anupam Rasayan India Limited (ANURASNS).
- Real-Time Data: Access to historical figures and forward-looking projections (highlighted in the yellow cells).
- Forecasting Flexibility: Modify key assumptions such as revenue growth, EBITDA percentage, and WACC.
- Instant Calculations: Quickly observe how your inputs affect the valuation of Anupam Rasayan India Limited (ANURASNS).
- Professional Tool: Designed for investors, CFOs, consultants, and financial analysts.
- User-Friendly Interface: Organized for clarity and ease of navigation, complete with step-by-step guidance.
Key Features
- Accurate Financial Data for Anupam Rasayan India Limited (ANURASNS): Access reliable pre-loaded historical figures and future forecasts.
- Tailorable Forecast Assumptions: Modify the highlighted cells in yellow, including WACC, growth rates, and profit margins.
- Real-Time Calculations: Automatic adjustments for DCF, Net Present Value (NPV), and cash flow assessments.
- User-Friendly Dashboard: Clear charts and summaries designed to help you visualize your valuation outcomes.
- Designed for All Levels: An easy-to-navigate framework suitable for investors, CFOs, and consultants alike.
How It Works
- 1. Access the Template: Download and open the Excel file containing Anupam Rasayan India Limited’s (ANURASNS) preloaded data.
- 2. Modify Assumptions: Update critical inputs such as growth projections, WACC, and capital expenditures.
- 3. See Instant Results: The DCF model automatically calculates the intrinsic value and NPV in real time.
- 4. Explore Scenarios: Evaluate various forecasts to assess different valuation possibilities.
- 5. Present with Confidence: Deliver professional valuation insights to enhance your decision-making process.
Why Choose the ANURASNS Valuation Calculator?
- Time-Saving: Skip the hassle of building a DCF model from scratch – our tool is ready for immediate use.
- Enhanced Accuracy: Utilize trustworthy financial data and formulas to minimize valuation errors.
- Completely Customizable: Adjust the model to align with your unique assumptions and forecasts.
- User-Friendly: Intuitive charts and outputs make analyzing results straightforward.
- Preferred by Professionals: Crafted for those who prioritize accuracy and ease of use.
Who Can Benefit from This Product?
- Institutional Investors: Develop comprehensive and trustworthy valuation models for analyzing portfolios involving Anupam Rasayan India Limited (ANURASNS).
- Corporate Finance Departments: Evaluate valuation scenarios to inform strategic decisions within the organization.
- Consultants and Financial Advisors: Equip clients with precise valuation metrics related to Anupam Rasayan India Limited (ANURASNS).
- Academics and Students: Utilize authentic data for practicing and teaching concepts in financial modeling.
- Industry Enthusiasts: Gain insights into the market valuation methodologies for companies like Anupam Rasayan India Limited (ANURASNS).
Contents of the Template
- Pre-Filled Data: Features Anupam Rasayan India's historical financials and projections.
- Discounted Cash Flow Model: An editable DCF valuation framework with automatic calculations.
- Weighted Average Cost of Capital (WACC): A specific sheet for determining WACC based on tailored inputs.
- Key Financial Ratios: Evaluate Anupam Rasayan's profitability, efficiency, and leverage metrics.
- Customizable Inputs: Easily modify revenue growth, margins, and tax rates.
- Clear Dashboard: Visual representations and tables summarizing essential valuation outcomes.
Disclaimer
All information, articles, and product details provided on this website are for general informational and educational purposes only. We do not claim any ownership over, nor do we intend to infringe upon, any trademarks, copyrights, logos, brand names, or other intellectual property mentioned or depicted on this site. Such intellectual property remains the property of its respective owners, and any references here are made solely for identification or informational purposes, without implying any affiliation, endorsement, or partnership.
We make no representations or warranties, express or implied, regarding the accuracy, completeness, or suitability of any content or products presented. Nothing on this website should be construed as legal, tax, investment, financial, medical, or other professional advice. In addition, no part of this site—including articles or product references—constitutes a solicitation, recommendation, endorsement, advertisement, or offer to buy or sell any securities, franchises, or other financial instruments, particularly in jurisdictions where such activity would be unlawful.
All content is of a general nature and may not address the specific circumstances of any individual or entity. It is not a substitute for professional advice or services. Any actions you take based on the information provided here are strictly at your own risk. You accept full responsibility for any decisions or outcomes arising from your use of this website and agree to release us from any liability in connection with your use of, or reliance upon, the content or products found herein.