
|
American Public Education, Inc. (APEI) Évaluation DCF |
Entièrement Modifiable: Adapté À Vos Besoins Dans Excel Ou Sheets
Conception Professionnelle: Modèles Fiables Et Conformes Aux Normes Du Secteur
Pré-Construits Pour Une Utilisation Rapide Et Efficace
Compatible MAC/PC, entièrement débloqué
Aucune Expertise N'Est Requise; Facile À Suivre
American Public Education, Inc. (APEI) Bundle
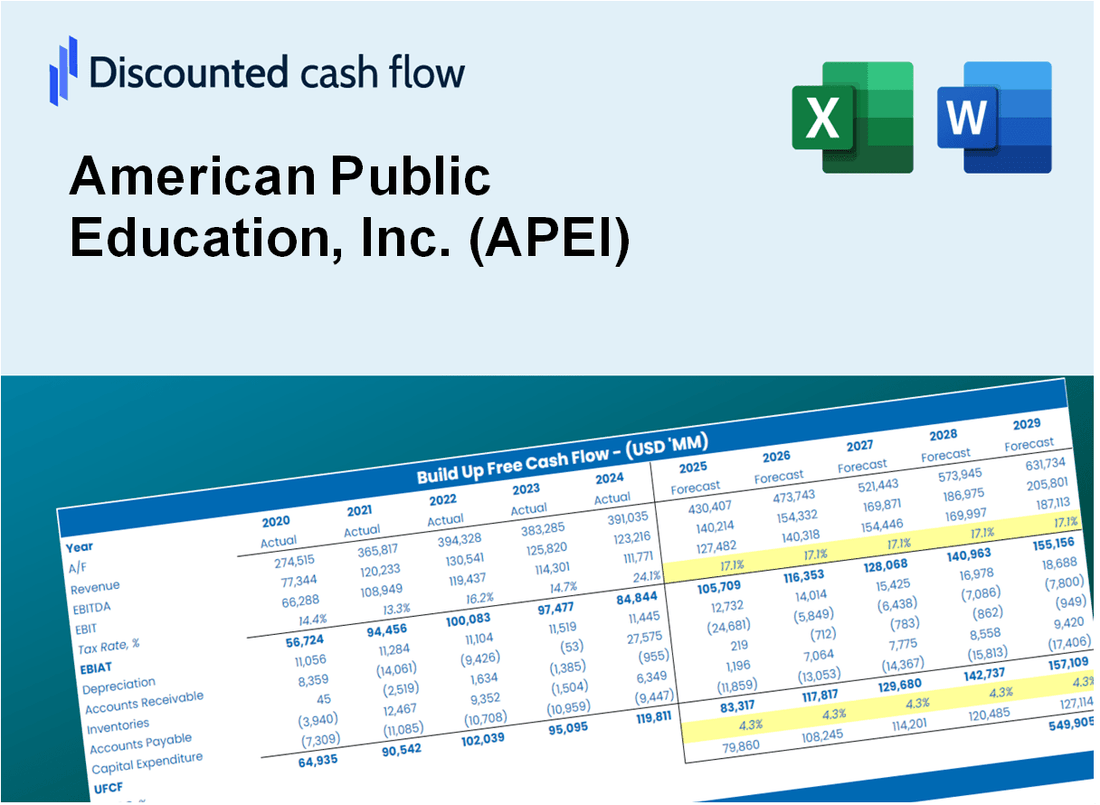
Gardez un aperçu de l'analyse de l'évaluation de votre American Public Education, Inc. (APEI) en utilisant notre calculatrice sophistiquée DCF! Équipée de vraies données APEI, ce modèle Excel vous permet d'ajuster les prévisions et les hypothèses pour déterminer avec précision la valeur intrinsèque d'American Public Education, Inc. (APEI).
Discounted Cash Flow (DCF) - (USD MM)
| Year | AY1 2020 |
AY2 2021 |
AY3 2022 |
AY4 2023 |
AY5 2024 |
FY1 2025 |
FY2 2026 |
FY3 2027 |
FY4 2028 |
FY5 2029 |
|---|---|---|---|---|---|---|---|---|---|---|
| Revenue | 321.8 | 418.8 | 606.3 | 600.5 | 624.6 | 746.3 | 891.8 | 1,065.6 | 1,273.3 | 1,521.5 |
| Revenue Growth, % | 0 | 30.15 | 44.78 | -0.95377 | 4 | 19.49 | 19.49 | 19.49 | 19.49 | 19.49 |
| EBITDA | 38.6 | 48.2 | -101.4 | -20.5 | 52.4 | 17.5 | 21.0 | 25.0 | 29.9 | 35.8 |
| EBITDA, % | 11.99 | 11.51 | -16.72 | -3.41 | 8.38 | 2.35 | 2.35 | 2.35 | 2.35 | 2.35 |
| Depreciation | 13.0 | 17.8 | 32.1 | 27.8 | 19.3 | 31.8 | 38.0 | 45.4 | 54.3 | 64.9 |
| Depreciation, % | 4.03 | 4.26 | 5.3 | 4.63 | 3.09 | 4.26 | 4.26 | 4.26 | 4.26 | 4.26 |
| EBIT | 25.6 | 30.4 | -133.5 | -48.3 | 33.1 | -14.3 | -17.1 | -20.4 | -24.3 | -29.1 |
| EBIT, % | 7.96 | 7.25 | -22.02 | -8.04 | 5.29 | -1.91 | -1.91 | -1.91 | -1.91 | -1.91 |
| Total Cash | 226.5 | 122.6 | 129.5 | 116.7 | 131.9 | 241.2 | 288.2 | 344.3 | 411.4 | 491.7 |
| Total Cash, percent | .0 | .0 | .0 | .0 | .0 | .0 | .0 | .0 | .0 | .0 |
| Account Receivables | 17.7 | 41.3 | 45.2 | 51.4 | 63.4 | 62.0 | 74.1 | 88.5 | 105.8 | 126.4 |
| Account Receivables, % | 5.49 | 9.87 | 7.46 | 8.57 | 10.15 | 8.31 | 8.31 | 8.31 | 8.31 | 8.31 |
| Inventories | .0 | .0 | .0 | .0 | .0 | .0 | .0 | .0 | .0 | .0 |
| Inventories, % | 0 | 0 | 0 | 0 | 0 | 0 | 0 | 0 | 0 | 0 |
| Accounts Payable | 3.8 | 13.5 | 3.8 | 8.7 | 7.8 | 11.5 | 13.8 | 16.4 | 19.7 | 23.5 |
| Accounts Payable, % | 1.17 | 3.22 | 0.62804 | 1.44 | 1.26 | 1.54 | 1.54 | 1.54 | 1.54 | 1.54 |
| Capital Expenditure | -4.9 | -11.8 | -16.4 | -13.9 | -21.1 | -19.0 | -22.7 | -27.2 | -32.5 | -38.8 |
| Capital Expenditure, % | -1.53 | -2.82 | -2.7 | -2.31 | -3.38 | -2.55 | -2.55 | -2.55 | -2.55 | -2.55 |
| Tax Rate, % | 47.92 | 47.92 | 47.92 | 47.92 | 47.92 | 47.92 | 47.92 | 47.92 | 47.92 | 47.92 |
| EBITAT | 18.6 | 21.3 | -101.5 | -39.4 | 17.2 | -10.1 | -12.0 | -14.4 | -17.2 | -20.5 |
| Depreciation | ||||||||||
| Changes in Account Receivables | ||||||||||
| Changes in Inventories | ||||||||||
| Changes in Accounts Payable | ||||||||||
| Capital Expenditure | ||||||||||
| UFCF | 12.8 | 13.4 | -99.3 | -26.8 | 2.7 | 7.8 | -6.6 | -7.9 | -9.4 | -11.2 |
| WACC, % | 9.63 | 9.6 | 9.65 | 9.7 | 9.44 | 9.6 | 9.6 | 9.6 | 9.6 | 9.6 |
| PV UFCF | ||||||||||
| SUM PV UFCF | -18.0 | |||||||||
| Long Term Growth Rate, % | 2.00 | |||||||||
| Free cash flow (T + 1) | -11 | |||||||||
| Terminal Value | -151 | |||||||||
| Present Terminal Value | -95 | |||||||||
| Enterprise Value | -113 | |||||||||
| Net Debt | 69 | |||||||||
| Equity Value | -182 | |||||||||
| Diluted Shares Outstanding, MM | 18 | |||||||||
| Equity Value Per Share | -10.03 |
What You Will Receive
- Flexible Forecast Inputs: Adjust key assumptions (growth %, margins, WACC) effortlessly to model various scenarios.
- Comprehensive Data: American Public Education, Inc. (APEI) financial data pre-loaded to facilitate your analysis.
- Automated DCF Calculations: The template computes Net Present Value (NPV) and intrinsic value automatically.
- Tailored and Professional: A refined Excel model that caters to your valuation requirements.
- Designed for Analysts and Investors: Perfect for evaluating projections, confirming strategies, and optimizing efficiency.
Key Features
- 🔍 Real-Life APEI Financials: Pre-filled historical and projected data for American Public Education, Inc. (APEI).
- ✏️ Fully Customizable Inputs: Adjust all critical parameters (yellow cells) like WACC, growth %, and tax rates.
- 📊 Professional DCF Valuation: Built-in formulas calculate APEI’s intrinsic value using the Discounted Cash Flow method.
- ⚡ Instant Results: Visualize APEI’s valuation instantly after making changes.
- Scenario Analysis: Test and compare outcomes for various financial assumptions side-by-side.
How It Works
- Step 1: Download the Excel file for American Public Education, Inc. (APEI).
- Step 2: Review APEI’s pre-filled financial data and forecasts.
- Step 3: Adjust key inputs such as enrollment growth, discount rates, and operational costs (highlighted cells).
- Step 4: Observe the DCF model update in real-time as you modify your assumptions.
- Step 5: Evaluate the outputs and leverage the results for your investment strategies.
Why Choose This Calculator for American Public Education, Inc. (APEI)?
- Accuracy: Utilizes reliable financial data specific to American Public Education, Inc. (APEI) for precise calculations.
- Flexibility: Allows users to easily adjust and experiment with various input parameters.
- Time-Saving: Avoid the complexities of constructing a DCF model from the ground up.
- Professional-Grade: Crafted with the expertise and detail expected at the CFO level.
- User-Friendly: Intuitive interface suitable for users with varying levels of financial modeling experience.
Who Should Use APEI's Services?
- Prospective Students: Explore diverse educational programs tailored to your career goals.
- Parents: Gain peace of mind knowing your child is receiving quality education from a trusted institution.
- Educators: Collaborate with APEI to enhance curriculum and contribute to student success.
- Career Changers: Acquire new skills and knowledge to transition into a fulfilling new profession.
- Employers: Partner with APEI to recruit well-trained graduates equipped for today's job market.
What the Template Contains
- Comprehensive DCF Model: Editable template with detailed valuation calculations tailored for American Public Education, Inc. (APEI).
- Real-World Data: APEI’s historical and projected financials preloaded for in-depth analysis.
- Customizable Parameters: Adjust WACC, growth rates, and tax assumptions to explore various scenarios.
- Financial Statements: Complete annual and quarterly breakdowns for enhanced insights.
- Key Ratios: Integrated analysis for profitability, efficiency, and leverage metrics.
- Dashboard with Visual Outputs: Charts and tables designed for clear, actionable results.
Disclaimer
All information, articles, and product details provided on this website are for general informational and educational purposes only. We do not claim any ownership over, nor do we intend to infringe upon, any trademarks, copyrights, logos, brand names, or other intellectual property mentioned or depicted on this site. Such intellectual property remains the property of its respective owners, and any references here are made solely for identification or informational purposes, without implying any affiliation, endorsement, or partnership.
We make no representations or warranties, express or implied, regarding the accuracy, completeness, or suitability of any content or products presented. Nothing on this website should be construed as legal, tax, investment, financial, medical, or other professional advice. In addition, no part of this site—including articles or product references—constitutes a solicitation, recommendation, endorsement, advertisement, or offer to buy or sell any securities, franchises, or other financial instruments, particularly in jurisdictions where such activity would be unlawful.
All content is of a general nature and may not address the specific circumstances of any individual or entity. It is not a substitute for professional advice or services. Any actions you take based on the information provided here are strictly at your own risk. You accept full responsibility for any decisions or outcomes arising from your use of this website and agree to release us from any liability in connection with your use of, or reliance upon, the content or products found herein.