
|
APTORUM GROUP LIMITED (APM) Évaluation DCF |
Entièrement Modifiable: Adapté À Vos Besoins Dans Excel Ou Sheets
Conception Professionnelle: Modèles Fiables Et Conformes Aux Normes Du Secteur
Pré-Construits Pour Une Utilisation Rapide Et Efficace
Compatible MAC/PC, entièrement débloqué
Aucune Expertise N'Est Requise; Facile À Suivre
Aptorum Group Limited (APM) Bundle
Améliorez votre stratégie d'investissement avec la calculatrice DCF Limited (APM) APTORUM (APM)! Explorez des données financières authentiques, ajustez les projections et dépenses de croissance et observez instantanément comment ces modifications affectent la valeur intrinsèque d'Aptorum Group Limited (APM).
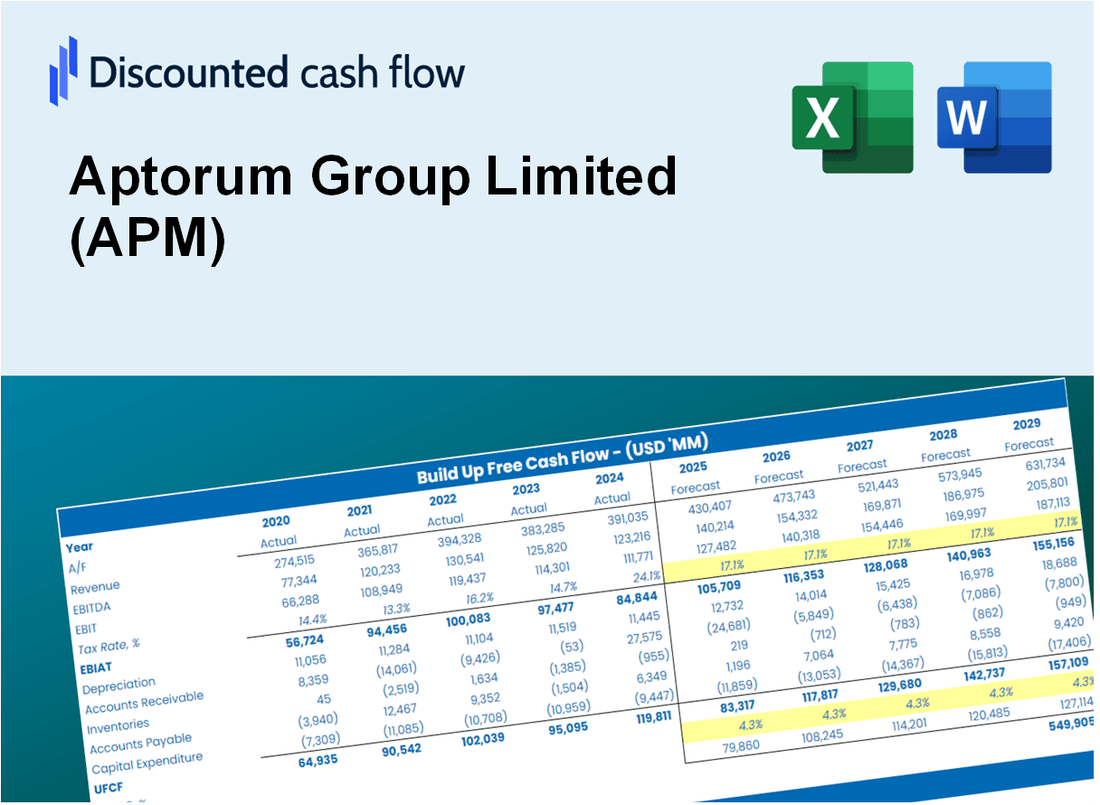
Discounted Cash Flow (DCF) - (USD MM)
| Year | AY1 2020 |
AY2 2021 |
AY3 2022 |
AY4 2023 |
AY5 2024 |
FY1 2025 |
FY2 2026 |
FY3 2027 |
FY4 2028 |
FY5 2029 |
|---|---|---|---|---|---|---|---|---|---|---|
| Revenue | .9 | 1.5 | 1.3 | .4 | .0 | .0 | .0 | .0 | .0 | .0 |
| Revenue Growth, % | 0 | 69.17 | -15.95 | -66.71 | -100 | -28.37 | -28.37 | -28.37 | -28.37 | -28.37 |
| EBITDA | 6.5 | -25.8 | -10.3 | -9.5 | -3.8 | .0 | .0 | .0 | .0 | .0 |
| EBITDA, % | 712.88 | -1674.98 | -796.11 | -2196.74 | 100 | -20 | -20 | -20 | -20 | -20 |
| Depreciation | 1.3 | 1.2 | 1.2 | 1.1 | .3 | .0 | .0 | .0 | .0 | .0 |
| Depreciation, % | 146.46 | 77.37 | 93.21 | 260.79 | 100 | 94.12 | 94.12 | 94.12 | 94.12 | 94.12 |
| EBIT | 5.2 | -27.0 | -11.5 | -10.6 | -4.0 | .0 | .0 | .0 | .0 | .0 |
| EBIT, % | 566.42 | -1752.34 | -889.32 | -2457.53 | 100 | -20 | -20 | -20 | -20 | -20 |
| Total Cash | 31.9 | 8.5 | 2.0 | 2.0 | .9 | .0 | .0 | .0 | .0 | .0 |
| Total Cash, percent | .0 | .0 | .0 | .0 | .0 | .0 | .0 | .0 | .0 | .0 |
| Account Receivables | .3 | 3.6 | 1.2 | .1 | .0 | .0 | .0 | .0 | .0 | .0 |
| Account Receivables, % | 37.42 | 230.93 | 91.1 | 16.45 | 100 | 68.99 | 68.99 | 68.99 | 68.99 | 68.99 |
| Inventories | .0 | .0 | .0 | .0 | .0 | .0 | .0 | .0 | .0 | .0 |
| Inventories, % | 4.29 | 2.32 | 2.14 | 0 | 100 | 21.75 | 21.75 | 21.75 | 21.75 | 21.75 |
| Accounts Payable | .0 | .0 | .0 | .0 | .0 | .0 | .0 | .0 | .0 | .0 |
| Accounts Payable, % | 0 | 0 | 0 | 0 | 100 | 20 | 20 | 20 | 20 | 20 |
| Capital Expenditure | -.2 | -.1 | -.2 | .0 | .0 | .0 | .0 | .0 | .0 | .0 |
| Capital Expenditure, % | -17.7 | -8.93 | -14.42 | -0.69776 | 100 | -8.35 | -8.35 | -8.35 | -8.35 | -8.35 |
| Tax Rate, % | -2.65 | -2.65 | -2.65 | -2.65 | -2.65 | -2.65 | -2.65 | -2.65 | -2.65 | -2.65 |
| EBITAT | 7.4 | -25.0 | -9.8 | -6.9 | -4.1 | .0 | .0 | .0 | .0 | .0 |
| Depreciation | ||||||||||
| Changes in Account Receivables | ||||||||||
| Changes in Inventories | ||||||||||
| Changes in Accounts Payable | ||||||||||
| Capital Expenditure | ||||||||||
| UFCF | 8.2 | -27.1 | -6.4 | -4.6 | -3.8 | .0 | .0 | .0 | .0 | .0 |
| WACC, % | 4.59 | 4.49 | 4.39 | 4.12 | 4.59 | 4.43 | 4.43 | 4.43 | 4.43 | 4.43 |
| PV UFCF | ||||||||||
| SUM PV UFCF | .0 | |||||||||
| Long Term Growth Rate, % | 2.00 | |||||||||
| Free cash flow (T + 1) | 0 | |||||||||
| Terminal Value | 0 | |||||||||
| Present Terminal Value | 0 | |||||||||
| Enterprise Value | 0 | |||||||||
| Net Debt | 2 | |||||||||
| Equity Value | -2 | |||||||||
| Diluted Shares Outstanding, MM | 5 | |||||||||
| Equity Value Per Share | -0.45 |
What You Will Receive
- Comprehensive Financial Model: Aptorum Group Limited’s (APM) actual data facilitates accurate DCF valuation.
- Complete Forecast Control: Modify revenue growth, profit margins, WACC, and other essential factors.
- Real-Time Calculations: Automatic updates provide immediate results as adjustments are made.
- Professional-Grade Template: A polished Excel file crafted for high-quality valuation.
- Flexible and Reusable: Designed for adaptability, allowing for repeated use in detailed forecasting.
Key Features
- 🔍 Real-Life APM Financials: Pre-filled historical and projected data for Aptorum Group Limited (APM).
- ✏️ Fully Customizable Inputs: Adjust all critical parameters (yellow cells) like WACC, growth %, and tax rates.
- 📊 Professional DCF Valuation: Built-in formulas calculate Aptorum’s intrinsic value using the Discounted Cash Flow method.
- ⚡ Instant Results: Visualize Aptorum’s valuation instantly after making changes.
- Scenario Analysis: Test and compare outcomes for various financial assumptions side-by-side.
How It Works
- Step 1: Download the Excel file.
- Step 2: Review Aptorum Group Limited’s (APM) pre-filled financial data and forecasts.
- Step 3: Modify key inputs such as revenue growth, WACC, and tax rates (highlighted cells).
- Step 4: Observe the DCF model update in real-time as you adjust assumptions.
- Step 5: Evaluate the outputs and leverage the results for your investment strategies.
Why Choose This Calculator for Aptorum Group Limited (APM)?
- Accuracy: Utilizes real Aptorum financial data for precise calculations.
- Flexibility: Allows users to easily adjust and test various inputs.
- Time-Saving: Eliminates the need to create a DCF model from the ground up.
- Professional-Grade: Crafted with the expertise and usability expected by CFOs.
- User-Friendly: Intuitive interface suitable for users with any level of financial modeling knowledge.
Who Should Use Aptorum Group Limited (APM)?
- Investors: Gain insights and make informed decisions with a robust investment analysis tool.
- Financial Analysts: Streamline your workflow with a comprehensive financial model tailored for Aptorum Group Limited (APM).
- Consultants: Efficiently modify the framework for client discussions or strategic reports.
- Finance Enthusiasts: Enhance your knowledge of investment strategies through detailed case studies of Aptorum Group Limited (APM).
- Educators and Students: Utilize it as a hands-on resource for finance and investment courses.
What the Template Contains
- Preloaded APM Data: Historical and projected financial data, including revenue, EBIT, and capital expenditures.
- DCF and WACC Models: Professional-grade sheets for calculating intrinsic value and Weighted Average Cost of Capital.
- Editable Inputs: Yellow-highlighted cells for adjusting revenue growth, tax rates, and discount rates.
- Financial Statements: Comprehensive annual and quarterly financials for deeper analysis.
- Key Ratios: Profitability, leverage, and efficiency ratios to evaluate performance.
- Dashboard and Charts: Visual summaries of valuation outcomes and assumptions.
Disclaimer
All information, articles, and product details provided on this website are for general informational and educational purposes only. We do not claim any ownership over, nor do we intend to infringe upon, any trademarks, copyrights, logos, brand names, or other intellectual property mentioned or depicted on this site. Such intellectual property remains the property of its respective owners, and any references here are made solely for identification or informational purposes, without implying any affiliation, endorsement, or partnership.
We make no representations or warranties, express or implied, regarding the accuracy, completeness, or suitability of any content or products presented. Nothing on this website should be construed as legal, tax, investment, financial, medical, or other professional advice. In addition, no part of this site—including articles or product references—constitutes a solicitation, recommendation, endorsement, advertisement, or offer to buy or sell any securities, franchises, or other financial instruments, particularly in jurisdictions where such activity would be unlawful.
All content is of a general nature and may not address the specific circumstances of any individual or entity. It is not a substitute for professional advice or services. Any actions you take based on the information provided here are strictly at your own risk. You accept full responsibility for any decisions or outcomes arising from your use of this website and agree to release us from any liability in connection with your use of, or reliance upon, the content or products found herein.