
|
Appian Corporation (APPN) Évaluation DCF |
Entièrement Modifiable: Adapté À Vos Besoins Dans Excel Ou Sheets
Conception Professionnelle: Modèles Fiables Et Conformes Aux Normes Du Secteur
Pré-Construits Pour Une Utilisation Rapide Et Efficace
Compatible MAC/PC, entièrement débloqué
Aucune Expertise N'Est Requise; Facile À Suivre
Appian Corporation (APPN) Bundle
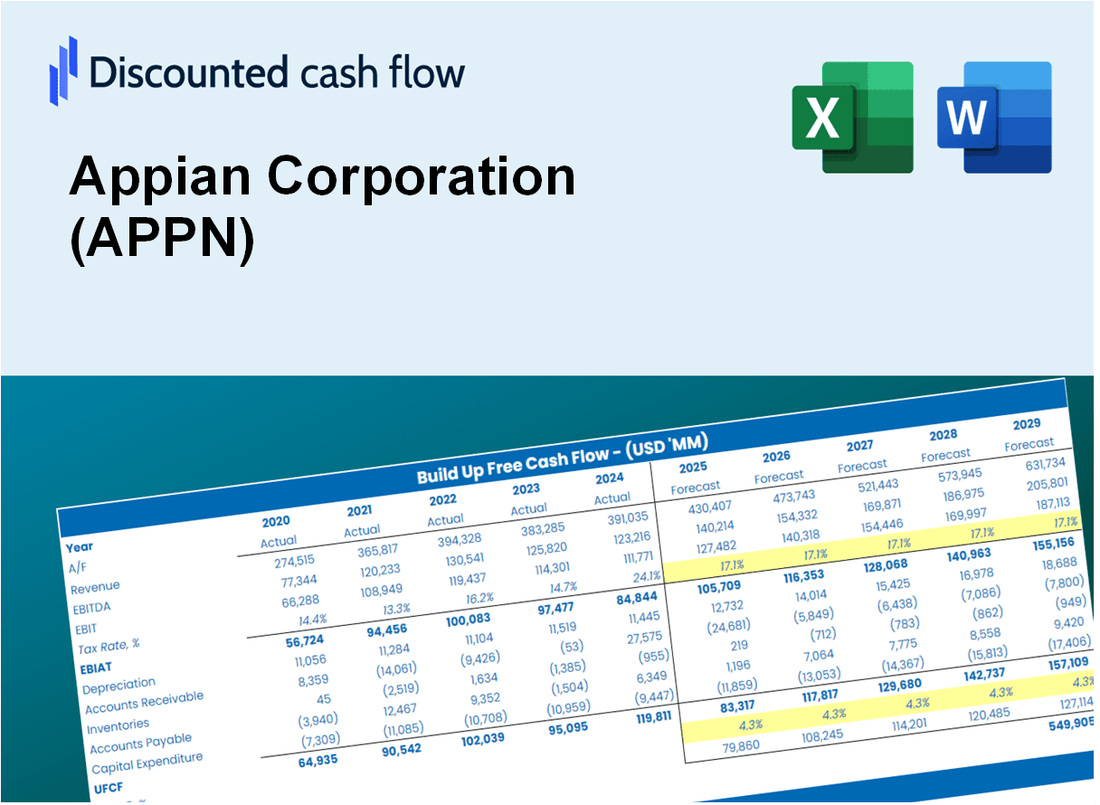
Évaluez les perspectives financières de l'Appian Corporation (APPN) comme un expert! Cette calculatrice DCF (APPN) fournit des données financières pré-remplies et la flexibilité pour modifier la croissance des revenus, le WACC, les marges et d'autres hypothèses essentielles pour s'aligner sur vos projections.
Discounted Cash Flow (DCF) - (USD MM)
| Year | AY1 2020 |
AY2 2021 |
AY3 2022 |
AY4 2023 |
AY5 2024 |
FY1 2025 |
FY2 2026 |
FY3 2027 |
FY4 2028 |
FY5 2029 |
|---|---|---|---|---|---|---|---|---|---|---|
| Revenue | 304.6 | 369.3 | 468.0 | 545.4 | 617.0 | 736.8 | 879.8 | 1,050.6 | 1,254.6 | 1,498.1 |
| Revenue Growth, % | 0 | 21.24 | 26.74 | 16.53 | 13.14 | 19.41 | 19.41 | 19.41 | 19.41 | 19.41 |
| EBITDA | -26.3 | -81.7 | -141.3 | -80.9 | -57.6 | -125.4 | -149.8 | -178.8 | -213.6 | -255.0 |
| EBITDA, % | -8.62 | -22.14 | -30.18 | -14.83 | -9.33 | -17.02 | -17.02 | -17.02 | -17.02 | -17.02 |
| Depreciation | 5.9 | 5.7 | 7.3 | 9.5 | 10.0 | 12.4 | 14.8 | 17.6 | 21.1 | 25.2 |
| Depreciation, % | 1.92 | 1.56 | 1.56 | 1.74 | 1.63 | 1.68 | 1.68 | 1.68 | 1.68 | 1.68 |
| EBIT | -32.1 | -87.5 | -148.6 | -90.4 | -67.6 | -137.8 | -164.5 | -196.5 | -234.6 | -280.2 |
| EBIT, % | -10.54 | -23.69 | -31.74 | -16.57 | -10.96 | -18.7 | -18.7 | -18.7 | -18.7 | -18.7 |
| Total Cash | 222.3 | 156.0 | 196.0 | 159.0 | 159.9 | 312.6 | 373.3 | 445.8 | 532.4 | 635.7 |
| Total Cash, percent | .0 | .0 | .0 | .0 | .0 | .0 | .0 | .0 | .0 | .0 |
| Account Receivables | 97.3 | 130.0 | 166.0 | 171.6 | 195.1 | 244.2 | 291.6 | 348.2 | 415.7 | 496.5 |
| Account Receivables, % | 31.94 | 35.22 | 35.46 | 31.46 | 31.61 | 33.14 | 33.14 | 33.14 | 33.14 | 33.14 |
| Inventories | .0 | .0 | .0 | .0 | .0 | .0 | .0 | .0 | .0 | .0 |
| Inventories, % | 0 | 0 | 0 | 0 | 0 | 0 | 0 | 0 | 0 | 0 |
| Accounts Payable | 3.0 | 5.8 | 8.0 | 6.2 | 4.3 | 9.0 | 10.7 | 12.8 | 15.2 | 18.2 |
| Accounts Payable, % | 0.97415 | 1.56 | 1.71 | 1.13 | 0.70046 | 1.22 | 1.22 | 1.22 | 1.22 | 1.22 |
| Capital Expenditure | -1.3 | -6.1 | -9.1 | -9.6 | -3.8 | -9.4 | -11.2 | -13.4 | -16.0 | -19.1 |
| Capital Expenditure, % | -0.41074 | -1.64 | -1.94 | -1.77 | -0.61554 | -1.28 | -1.28 | -1.28 | -1.28 | -1.28 |
| Tax Rate, % | -1.16 | -1.16 | -1.16 | -1.16 | -1.16 | -1.16 | -1.16 | -1.16 | -1.16 | -1.16 |
| EBITAT | -33.0 | -88.3 | -149.2 | -93.0 | -68.4 | -137.8 | -164.5 | -196.5 | -234.6 | -280.2 |
| Depreciation | ||||||||||
| Changes in Account Receivables | ||||||||||
| Changes in Inventories | ||||||||||
| Changes in Accounts Payable | ||||||||||
| Capital Expenditure | ||||||||||
| UFCF | -122.7 | -118.6 | -184.7 | -100.6 | -87.5 | -179.3 | -206.7 | -246.8 | -294.7 | -351.9 |
| WACC, % | 7.87 | 7.87 | 7.87 | 7.87 | 7.87 | 7.87 | 7.87 | 7.87 | 7.87 | 7.87 |
| PV UFCF | ||||||||||
| SUM PV UFCF | -998.9 | |||||||||
| Long Term Growth Rate, % | 2.00 | |||||||||
| Free cash flow (T + 1) | -359 | |||||||||
| Terminal Value | -6,110 | |||||||||
| Present Terminal Value | -4,183 | |||||||||
| Enterprise Value | -5,182 | |||||||||
| Net Debt | 196 | |||||||||
| Equity Value | -5,378 | |||||||||
| Diluted Shares Outstanding, MM | 73 | |||||||||
| Equity Value Per Share | -73.69 |
What You Will Receive
- Adjustable Forecast Parameters: Effortlessly modify key assumptions (growth %, margins, WACC) to explore various scenarios.
- Industry-Specific Data: Appian Corporation’s financial information pre-loaded to facilitate your analysis.
- Automated DCF Calculations: The template computes Net Present Value (NPV) and intrinsic value automatically.
- Tailored and Professional: A refined Excel model that customizes to meet your valuation requirements.
- Designed for Analysts and Investors: Perfect for evaluating projections, confirming strategies, and enhancing efficiency.
Key Features
- Comprehensive Financial Data: Gain access to precise historical data and future forecasts for Appian Corporation (APPN).
- Adjustable Forecast Variables: Modify the highlighted cells for key metrics like WACC, growth rates, and profit margins.
- Real-Time Analytics: Instant updates to DCF, Net Present Value (NPV), and cash flow evaluations.
- Interactive Dashboard: User-friendly charts and summaries to help you visualize your valuation insights.
- Designed for All Skill Levels: An intuitive layout tailored for investors, CFOs, and consultants alike.
How It Works
- Download: Obtain the ready-to-use Excel file containing Appian Corporation's (APPN) financial data.
- Customize: Modify projections, including revenue growth, EBITDA %, and WACC.
- Update Automatically: The intrinsic value and NPV calculations refresh in real-time.
- Test Scenarios: Develop various projections and instantly compare results.
- Make Decisions: Utilize the valuation outcomes to inform your investment approach.
Why Choose This Calculator for Appian Corporation (APPN)?
- Comprehensive Tool: Offers DCF, WACC, and financial ratio analyses tailored for Appian Corporation.
- Customizable Inputs: Modify yellow-highlighted cells to explore different scenarios specific to Appian Corporation.
- Detailed Insights: Automatically computes Appian Corporation’s intrinsic value and Net Present Value.
- Preloaded Data: Historical and projected data provide reliable starting points for analysis.
- Professional Quality: Perfect for financial analysts, investors, and business consultants focusing on Appian Corporation.
Who Should Use This Product?
- Finance Students: Discover valuation methodologies and apply them with real-time data for Appian Corporation (APPN).
- Academics: Integrate industry-standard models into your teaching or research focused on Appian Corporation (APPN).
- Investors: Evaluate your investment strategies and assess valuation results for Appian Corporation (APPN).
- Analysts: Enhance your analysis process with a ready-to-use, customizable DCF model tailored for Appian Corporation (APPN).
- Small Business Owners: Understand the analytical approaches used for large tech companies like Appian Corporation (APPN).
What the Template Contains
- Pre-Filled DCF Model: Appian Corporation’s (APPN) financial data preloaded for immediate use.
- WACC Calculator: Detailed calculations for Weighted Average Cost of Capital.
- Financial Ratios: Evaluate Appian Corporation’s (APPN) profitability, leverage, and efficiency.
- Editable Inputs: Change assumptions such as growth, margins, and CAPEX to fit your scenarios.
- Financial Statements: Annual and quarterly reports to support detailed analysis.
- Interactive Dashboard: Easily visualize key valuation metrics and results.
Disclaimer
All information, articles, and product details provided on this website are for general informational and educational purposes only. We do not claim any ownership over, nor do we intend to infringe upon, any trademarks, copyrights, logos, brand names, or other intellectual property mentioned or depicted on this site. Such intellectual property remains the property of its respective owners, and any references here are made solely for identification or informational purposes, without implying any affiliation, endorsement, or partnership.
We make no representations or warranties, express or implied, regarding the accuracy, completeness, or suitability of any content or products presented. Nothing on this website should be construed as legal, tax, investment, financial, medical, or other professional advice. In addition, no part of this site—including articles or product references—constitutes a solicitation, recommendation, endorsement, advertisement, or offer to buy or sell any securities, franchises, or other financial instruments, particularly in jurisdictions where such activity would be unlawful.
All content is of a general nature and may not address the specific circumstances of any individual or entity. It is not a substitute for professional advice or services. Any actions you take based on the information provided here are strictly at your own risk. You accept full responsibility for any decisions or outcomes arising from your use of this website and agree to release us from any liability in connection with your use of, or reliance upon, the content or products found herein.