
|
Aquabounty Technologies, Inc. (AQB) Évaluation DCF |
Entièrement Modifiable: Adapté À Vos Besoins Dans Excel Ou Sheets
Conception Professionnelle: Modèles Fiables Et Conformes Aux Normes Du Secteur
Pré-Construits Pour Une Utilisation Rapide Et Efficace
Compatible MAC/PC, entièrement débloqué
Aucune Expertise N'Est Requise; Facile À Suivre
AquaBounty Technologies, Inc. (AQB) Bundle
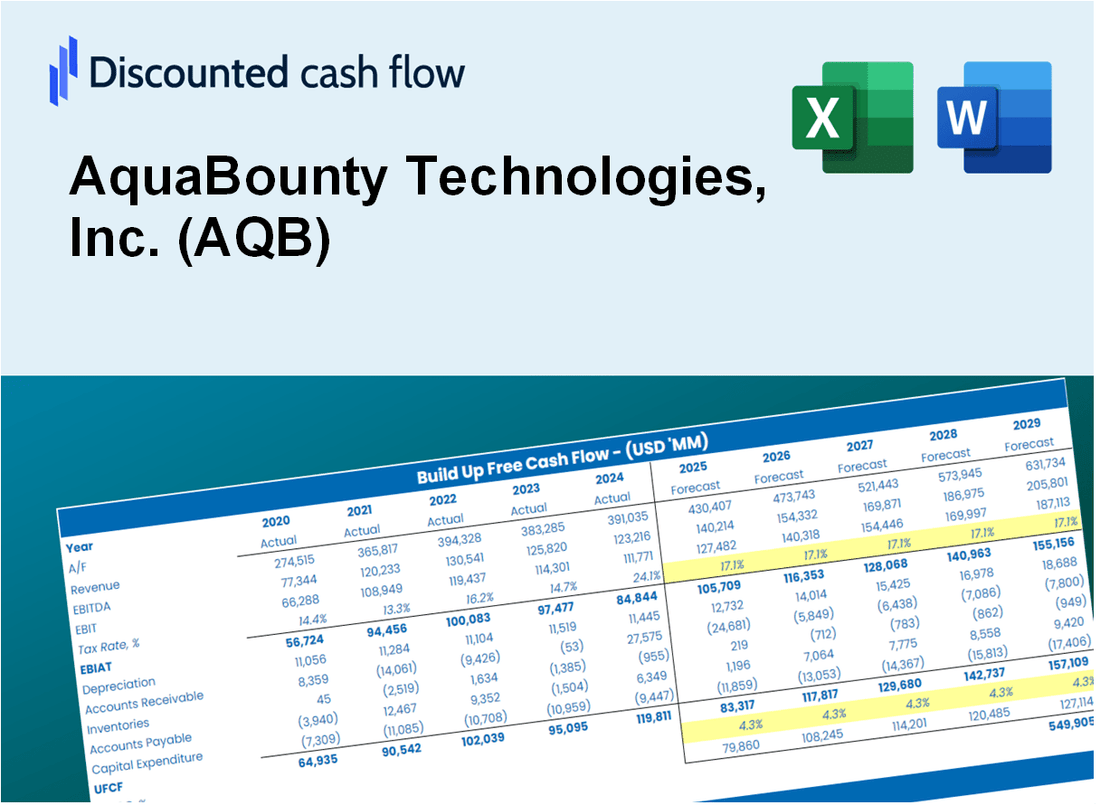
Que vous soyez un investisseur ou un analyste, cette calculatrice DCF (AQB) est votre ressource incontournable pour une évaluation précise. Avec des données réelles d'Aquabounty Technologies, Inc., vous pouvez modifier les prévisions et observer instantanément les effets.
What You Will Get
- Pre-Filled Financial Model: AquaBounty's actual data allows for accurate DCF valuation.
- Full Forecast Control: Modify revenue growth, margins, WACC, and other essential drivers.
- Instant Calculations: Automatic updates provide real-time results as you adjust inputs.
- Investor-Ready Template: A polished Excel file crafted for high-quality valuation.
- Customizable and Reusable: Designed for adaptability, enabling repeated use for in-depth forecasts.
Key Features
- 🔍 Real-Life AQB Financials: Pre-filled historical and projected data for AquaBounty Technologies, Inc. (AQB).
- ✏️ Fully Customizable Inputs: Adjust all critical parameters (yellow cells) like WACC, growth %, and tax rates.
- 📊 Professional DCF Valuation: Built-in formulas calculate AquaBounty’s intrinsic value using the Discounted Cash Flow method.
- ⚡ Instant Results: Visualize AquaBounty’s valuation instantly after making changes.
- Scenario Analysis: Test and compare outcomes for various financial assumptions side-by-side.
How It Works
- Step 1: Download the prebuilt Excel template featuring AquaBounty Technologies, Inc. (AQB) data.
- Step 2: Navigate through the pre-filled sheets to familiarize yourself with the essential metrics.
- Step 3: Modify forecasts and assumptions in the editable yellow cells (WACC, growth, margins).
- Step 4: Instantly see the recalculated results, including AquaBounty's intrinsic value.
- Step 5: Use the outputs to make informed investment decisions or create reports.
Why Choose This Calculator for AquaBounty Technologies, Inc. (AQB)?
- Accurate Data: Access to real AquaBounty financial metrics ensures trustworthy valuation outcomes.
- Customizable: Tailor essential parameters such as growth rates, WACC, and tax rates to align with your forecasts.
- Time-Saving: Pre-configured calculations save you the hassle of starting from the ground up.
- Professional-Grade Tool: Crafted for investors, analysts, and consultants in the aquaculture sector.
- User-Friendly: An intuitive design and guided instructions make it accessible for all users.
Who Should Use This Product?
- Individual Investors: Make informed decisions about buying or selling AquaBounty Technologies stock (AQB).
- Financial Analysts: Streamline valuation processes with ready-to-use financial models specific to AquaBounty Technologies (AQB).
- Consultants: Deliver professional valuation insights related to AquaBounty Technologies (AQB) to clients quickly and accurately.
- Business Owners: Understand how innovative companies like AquaBounty Technologies (AQB) are valued to guide your own strategy.
- Finance Students: Learn valuation techniques using real-world data and scenarios from AquaBounty Technologies (AQB).
What the Template Contains
- Pre-Filled Data: Includes AquaBounty Technologies' historical financials and forecasts.
- Discounted Cash Flow Model: Editable DCF valuation model with automatic calculations.
- Weighted Average Cost of Capital (WACC): A dedicated sheet for calculating WACC based on custom inputs.
- Key Financial Ratios: Analyze AquaBounty Technologies' profitability, efficiency, and leverage.
- Customizable Inputs: Edit revenue growth, margins, and tax rates with ease.
- Clear Dashboard: Charts and tables summarizing key valuation results.
Disclaimer
All information, articles, and product details provided on this website are for general informational and educational purposes only. We do not claim any ownership over, nor do we intend to infringe upon, any trademarks, copyrights, logos, brand names, or other intellectual property mentioned or depicted on this site. Such intellectual property remains the property of its respective owners, and any references here are made solely for identification or informational purposes, without implying any affiliation, endorsement, or partnership.
We make no representations or warranties, express or implied, regarding the accuracy, completeness, or suitability of any content or products presented. Nothing on this website should be construed as legal, tax, investment, financial, medical, or other professional advice. In addition, no part of this site—including articles or product references—constitutes a solicitation, recommendation, endorsement, advertisement, or offer to buy or sell any securities, franchises, or other financial instruments, particularly in jurisdictions where such activity would be unlawful.
All content is of a general nature and may not address the specific circumstances of any individual or entity. It is not a substitute for professional advice or services. Any actions you take based on the information provided here are strictly at your own risk. You accept full responsibility for any decisions or outcomes arising from your use of this website and agree to release us from any liability in connection with your use of, or reliance upon, the content or products found herein.