
|
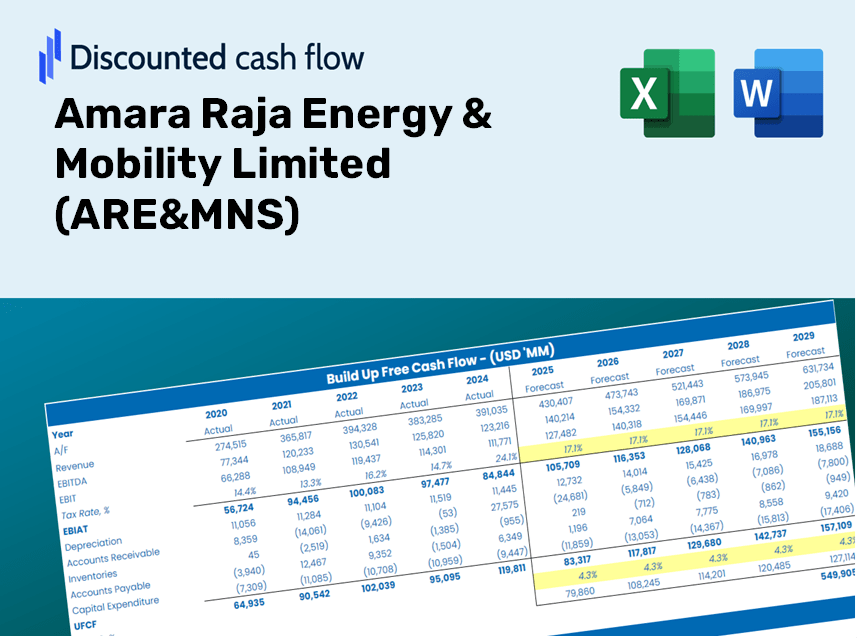
Énergie amara raja & Mobility Limited (Are & M.NS) DCF Valuation |
Entièrement Modifiable: Adapté À Vos Besoins Dans Excel Ou Sheets
Conception Professionnelle: Modèles Fiables Et Conformes Aux Normes Du Secteur
Pré-Construits Pour Une Utilisation Rapide Et Efficace
Compatible MAC/PC, entièrement débloqué
Aucune Expertise N'Est Requise; Facile À Suivre
Amara Raja Energy & Mobility Limited (ARE&M.NS) Bundle
Que vous soyez un investisseur ou un analyste, ce calculateur DCF (Are & MNS) est votre outil incontournable pour une évaluation précise. Préchargé avec de vraies données d'Amara Raja Energy & Mobility Limited, vous pouvez ajuster les prévisions et observer instantanément les effets.
Discounted Cash Flow (DCF) - (USD MM)
| Year | AY1 2020 |
AY2 2021 |
AY3 2022 |
AY4 2023 |
AY5 2024 |
FY1 2025 |
FY2 2026 |
FY3 2027 |
FY4 2028 |
FY5 2029 |
|---|---|---|---|---|---|---|---|---|---|---|
| Revenue | 1,885.6 | 2,114.2 | 2,589.0 | 2,842.5 | 3,049.7 | 3,443.6 | 3,888.3 | 4,390.5 | 4,957.5 | 5,597.8 |
| Revenue Growth, % | 0 | 12.12 | 22.46 | 9.79 | 7.29 | 12.91 | 12.91 | 12.91 | 12.91 | 12.91 |
| EBITDA | 1,230.2 | 1,351.4 | 1,629.2 | 1,448.7 | 1,899.0 | 2,102.8 | 2,374.4 | 2,681.0 | 3,027.3 | 3,418.3 |
| EBITDA, % | 65.24 | 63.92 | 62.93 | 50.97 | 62.27 | 61.06 | 61.06 | 61.06 | 61.06 | 61.06 |
| Depreciation | 987.6 | 1,552.4 | 2,374.8 | 1,093.5 | 1,202.4 | 2,034.7 | 2,297.4 | 2,594.2 | 2,929.2 | 3,307.5 |
| Depreciation, % | 52.38 | 73.43 | 91.73 | 38.47 | 39.43 | 59.09 | 59.09 | 59.09 | 59.09 | 59.09 |
| EBIT | 242.6 | -201.1 | -745.6 | 355.2 | 696.6 | 68.1 | 76.9 | 86.9 | 98.1 | 110.8 |
| EBIT, % | 12.86 | -9.51 | -28.8 | 12.5 | 22.84 | 1.98 | 1.98 | 1.98 | 1.98 | 1.98 |
| Total Cash | 568.5 | 361.3 | 825.2 | 618.2 | 552.1 | 819.4 | 925.2 | 1,044.7 | 1,179.6 | 1,331.9 |
| Total Cash, percent | .0 | .0 | .0 | .0 | .0 | .0 | .0 | .0 | .0 | .0 |
| Account Receivables | 48.6 | 91.1 | 66.8 | 64.1 | 168.5 | 118.8 | 134.1 | 151.5 | 171.0 | 193.1 |
| Account Receivables, % | 2.58 | 4.31 | 2.58 | 2.26 | 5.52 | 3.45 | 3.45 | 3.45 | 3.45 | 3.45 |
| Inventories | .0 | .0 | .0 | .0 | .0 | .0 | .0 | .0 | .0 | .0 |
| Inventories, % | 0 | 0 | 0 | 0 | 0 | 0 | 0 | 0 | 0 | 0 |
| Accounts Payable | 285.0 | 513.4 | 389.7 | 524.4 | 534.8 | 622.9 | 703.3 | 794.2 | 896.7 | 1,012.5 |
| Accounts Payable, % | 15.12 | 24.28 | 15.05 | 18.45 | 17.54 | 18.09 | 18.09 | 18.09 | 18.09 | 18.09 |
| Capital Expenditure | -3,268.8 | -7,333.9 | .0 | .0 | .0 | -1,377.4 | -1,555.3 | -1,756.2 | -1,983.0 | -2,239.1 |
| Capital Expenditure, % | -173.35 | -346.9 | 0 | 0 | 0 | -40 | -40 | -40 | -40 | -40 |
| Tax Rate, % | 36.77 | 36.77 | 36.77 | 36.77 | 36.77 | 36.77 | 36.77 | 36.77 | 36.77 | 36.77 |
| EBITAT | 173.4 | -128.1 | -579.9 | 131.0 | 440.5 | 42.7 | 48.2 | 54.4 | 61.4 | 69.3 |
| Depreciation | ||||||||||
| Changes in Account Receivables | ||||||||||
| Changes in Inventories | ||||||||||
| Changes in Accounts Payable | ||||||||||
| Capital Expenditure | ||||||||||
| UFCF | -1,871.4 | -5,723.7 | 1,695.5 | 1,361.9 | 1,548.9 | 837.6 | 855.4 | 965.9 | 1,090.6 | 1,231.5 |
| WACC, % | 5.7 | 5.53 | 5.84 | 4.94 | 5.52 | 5.51 | 5.51 | 5.51 | 5.51 | 5.51 |
| PV UFCF | ||||||||||
| SUM PV UFCF | 4,207.0 | |||||||||
| Long Term Growth Rate, % | 4.00 | |||||||||
| Free cash flow (T + 1) | 1,281 | |||||||||
| Terminal Value | 85,066 | |||||||||
| Present Terminal Value | 65,070 | |||||||||
| Enterprise Value | 69,277 | |||||||||
| Net Debt | 12,199 | |||||||||
| Equity Value | 57,078 | |||||||||
| Diluted Shares Outstanding, MM | 172 | |||||||||
| Equity Value Per Share | 331.71 |
What You Will Receive
- Authentic ARE&MNS Data: Preloaded financial metrics – including revenue and EBIT – based on both actual and projected data.
- Comprehensive Customization: Modify all essential parameters (yellow cells) such as WACC, growth rates, and tax percentages.
- Immediate Valuation Adjustments: Automatic recalculations to evaluate how changes affect the fair value of ARE&MNS.
- Flexible Excel Template: Designed for easy modifications, scenario analysis, and thorough projections.
- Efficient and Precise: Eliminate the need to build models from the ground up while ensuring accuracy and adaptability.
Core Highlights
- Authentic ARE&MNS Financial Data: Gain access to reliable historical figures and future forecasts.
- Tailorable Assumptions for Projections: Modify the highlighted fields such as WACC, growth rates, and margins.
- Real-Time Calculations: Instant updates for DCF, Net Present Value (NPV), and cash flow evaluations.
- User-Friendly Dashboard: Clear and concise charts and summaries to help visualize your valuation insights.
- Designed for All Skill Levels: An intuitive framework tailored for investors, CFOs, and consultants alike.
How It Works
- Step 1: Download the Excel file.
- Step 2: Review the pre-filled data for Amara Raja Energy & Mobility Limited (ARE&MNS) [ARE&MNS], including historical and projected figures.
- Step 3: Modify the key assumptions (highlighted in yellow) according to your analysis.
- Step 4: Observe the automatic recalculations of Amara Raja Energy & Mobility Limited's (ARE&MNS) [ARE&MNS] intrinsic value.
- Step 5: Utilize the results to inform your investment decisions or reporting.
Why Choose This Calculator for Amara Raja Energy & Mobility Limited (ARE&MNS)?
- User-Friendly Interface: Tailored for both newcomers and seasoned users.
- Customizable Assumptions: Effortlessly adjust inputs to suit your specific analysis.
- Real-Time Updates: Witness immediate changes to ARE&MNS’s valuation as you modify your inputs.
- Pre-Configured: Comes loaded with actual financial data from ARE&MNS for swift evaluations.
- Preferred by Experts: Utilized by investors and analysts for making well-informed decisions.
Who Can Benefit from This Product?
- Institutional Investors: Develop comprehensive and accurate valuation models for investment analysis in Amara Raja Energy & Mobility Limited (ARE&MNS).
- Corporate Financial Teams: Evaluate valuation scenarios to shape strategic decisions within the organization.
- Financial Consultants and Advisors: Deliver precise valuation insights to clients focused on Amara Raja Energy & Mobility Limited (ARE&MNS).
- Students and Academic Instructors: Utilize real-time data to enhance the learning experience in financial modeling.
- Energy Sector Enthusiasts: Gain insights into market valuation methodologies applied to companies like Amara Raja Energy & Mobility Limited (ARE&MNS).
Contents of the Template
- Operating and Balance Sheet Data: Pre-filled historical data and forecasts for Amara Raja Energy & Mobility Limited (ARE&MNS), including revenue, EBITDA, EBIT, and capital expenditures.
- WACC Calculation: A dedicated sheet for calculating the Weighted Average Cost of Capital (WACC), featuring parameters such as Beta, risk-free rate, and share price.
- DCF Valuation (Unlevered and Levered): Customizable Discounted Cash Flow models that provide intrinsic value with comprehensive calculations.
- Financial Statements: Pre-loaded annual and quarterly financial statements to facilitate thorough analysis.
- Key Ratios: A set of profitability, leverage, and efficiency ratios tailored for Amara Raja Energy & Mobility Limited (ARE&MNS).
- Dashboard and Charts: A visual summary of valuation outputs and underlying assumptions for easy analysis of results.
Disclaimer
All information, articles, and product details provided on this website are for general informational and educational purposes only. We do not claim any ownership over, nor do we intend to infringe upon, any trademarks, copyrights, logos, brand names, or other intellectual property mentioned or depicted on this site. Such intellectual property remains the property of its respective owners, and any references here are made solely for identification or informational purposes, without implying any affiliation, endorsement, or partnership.
We make no representations or warranties, express or implied, regarding the accuracy, completeness, or suitability of any content or products presented. Nothing on this website should be construed as legal, tax, investment, financial, medical, or other professional advice. In addition, no part of this site—including articles or product references—constitutes a solicitation, recommendation, endorsement, advertisement, or offer to buy or sell any securities, franchises, or other financial instruments, particularly in jurisdictions where such activity would be unlawful.
All content is of a general nature and may not address the specific circumstances of any individual or entity. It is not a substitute for professional advice or services. Any actions you take based on the information provided here are strictly at your own risk. You accept full responsibility for any decisions or outcomes arising from your use of this website and agree to release us from any liability in connection with your use of, or reliance upon, the content or products found herein.