
|
Asian Paints Limited (asianpaint.NS) Valation DCF |
Entièrement Modifiable: Adapté À Vos Besoins Dans Excel Ou Sheets
Conception Professionnelle: Modèles Fiables Et Conformes Aux Normes Du Secteur
Pré-Construits Pour Une Utilisation Rapide Et Efficace
Compatible MAC/PC, entièrement débloqué
Aucune Expertise N'Est Requise; Facile À Suivre
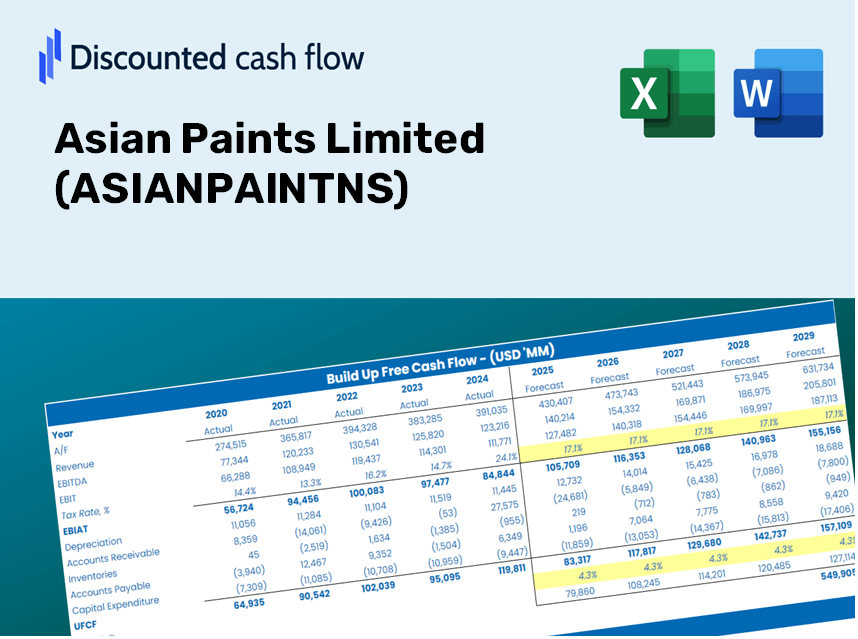
Asian Paints Limited (ASIANPAINT.NS) Bundle
Que vous soyez un investisseur ou un analyste, cette calculatrice DCF (AsianPaintS) est votre ressource incontournable pour une évaluation précise. Préchargé avec des données réelles d'Asian Paints Limited, vous pouvez ajuster les prévisions et observer instantanément les effets.
Discounted Cash Flow (DCF) - (USD MM)
| Year | AY1 2021 |
AY2 2022 |
AY3 2023 |
AY4 2024 |
AY5 2025 |
FY1 2026 |
FY2 2027 |
FY3 2028 |
FY4 2029 |
FY5 2030 |
|---|---|---|---|---|---|---|---|---|---|---|
| Revenue | 215,035.6 | 289,818.7 | 344,300.9 | 354,375.2 | 338,594.0 | 382,652.3 | 432,443.6 | 488,713.8 | 552,305.9 | 624,172.7 |
| Revenue Growth, % | 0 | 34.78 | 18.8 | 2.93 | -4.45 | 13.01 | 13.01 | 13.01 | 13.01 | 13.01 |
| EBITDA | 46,132.9 | 45,386.0 | 60,200.0 | 72,326.7 | 56,039.9 | 70,070.4 | 79,188.1 | 89,492.1 | 101,137.0 | 114,297.1 |
| EBITDA, % | 21.45 | 15.66 | 17.48 | 20.41 | 16.55 | 18.31 | 18.31 | 18.31 | 18.31 | 18.31 |
| Depreciation | 5,489.6 | 5,513.5 | 5,569.9 | 4,903.1 | 6,241.2 | 7,117.2 | 8,043.3 | 9,090.0 | 10,272.8 | 11,609.5 |
| Depreciation, % | 2.55 | 1.9 | 1.62 | 1.38 | 1.84 | 1.86 | 1.86 | 1.86 | 1.86 | 1.86 |
| EBIT | 40,643.3 | 39,872.5 | 54,630.1 | 67,423.6 | 49,798.7 | 62,953.2 | 71,144.7 | 80,402.2 | 90,864.2 | 102,687.6 |
| EBIT, % | 18.9 | 13.76 | 15.87 | 19.03 | 14.71 | 16.45 | 16.45 | 16.45 | 16.45 | 16.45 |
| Total Cash | 47,609.1 | 40,251.1 | 46,312.9 | 54,263.9 | 46,875.7 | 60,180.9 | 68,011.7 | 76,861.5 | 86,862.8 | 98,165.6 |
| Total Cash, percent | .0 | .0 | .0 | .0 | .0 | .0 | .0 | .0 | .0 | .0 |
| Account Receivables | 26,045.9 | 45,882.8 | 53,923.0 | 57,378.4 | 43,136.5 | 55,512.8 | 62,736.2 | 70,899.5 | 80,125.0 | 90,551.0 |
| Account Receivables, % | 12.11 | 15.83 | 15.66 | 16.19 | 12.74 | 14.51 | 14.51 | 14.51 | 14.51 | 14.51 |
| Inventories | 37,986.0 | 61,529.8 | 62,106.4 | 59,234.1 | 67,192.7 | 71,551.0 | 80,861.4 | 91,383.2 | 103,274.1 | 116,712.2 |
| Inventories, % | 17.66 | 21.23 | 18.04 | 16.72 | 19.84 | 18.7 | 18.7 | 18.7 | 18.7 | 18.7 |
| Accounts Payable | 16,328.1 | 20,056.5 | 36,354.4 | 38,313.4 | 38,480.0 | 36,159.6 | 40,864.8 | 46,182.1 | 52,191.4 | 58,982.6 |
| Accounts Payable, % | 7.59 | 6.92 | 10.56 | 10.81 | 11.36 | 9.45 | 9.45 | 9.45 | 9.45 | 9.45 |
| Capital Expenditure | -2,887.1 | -5,507.0 | -14,456.1 | -24,960.8 | -18,300.7 | -15,221.9 | -17,202.6 | -19,441.0 | -21,970.7 | -24,829.6 |
| Capital Expenditure, % | -1.34 | -1.9 | -4.2 | -7.04 | -5.4 | -3.98 | -3.98 | -3.98 | -3.98 | -3.98 |
| Tax Rate, % | 28.14 | 28.14 | 28.14 | 28.14 | 28.14 | 28.14 | 28.14 | 28.14 | 28.14 | 28.14 |
| EBITAT | 29,642.4 | 28,854.9 | 39,434.4 | 50,103.4 | 35,786.9 | 45,787.1 | 51,745.0 | 58,478.1 | 66,087.4 | 74,686.8 |
| Depreciation | ||||||||||
| Changes in Account Receivables | ||||||||||
| Changes in Inventories | ||||||||||
| Changes in Accounts Payable | ||||||||||
| Capital Expenditure | ||||||||||
| UFCF | -15,458.9 | -10,790.9 | 38,229.3 | 31,421.6 | 30,177.3 | 18,627.5 | 30,757.2 | 34,759.3 | 39,282.3 | 44,393.7 |
| WACC, % | 5.47 | 5.47 | 5.47 | 5.47 | 5.47 | 5.47 | 5.47 | 5.47 | 5.47 | 5.47 |
| PV UFCF | ||||||||||
| SUM PV UFCF | 140,709.2 | |||||||||
| Long Term Growth Rate, % | 4.00 | |||||||||
| Free cash flow (T + 1) | 46,169 | |||||||||
| Terminal Value | 3,145,973 | |||||||||
| Present Terminal Value | 2,410,794 | |||||||||
| Enterprise Value | 2,551,504 | |||||||||
| Net Debt | 18,450 | |||||||||
| Equity Value | 2,533,053 | |||||||||
| Diluted Shares Outstanding, MM | 959 | |||||||||
| Equity Value Per Share | 2,641.70 |
Benefits You Will Receive
- Authentic ASIANPAINTNS Financial Data: Pre-loaded with historical and forecasted financial figures for accurate assessments.
- Completely Customizable Template: Easily adjust essential variables such as revenue growth, WACC, and EBITDA percentages.
- Instant Calculations: Observe real-time updates to Asian Paints Limited’s intrinsic value as you modify inputs.
- Professional Valuation Framework: Tailored for investors, analysts, and consultants aiming for precise DCF analyses.
- User-Centric Design: Intuitive layout and clear instructions suitable for users of all skill levels.
Key Features
- Pre-Loaded Data: Asian Paints Limited's historical financial statements and pre-filled forecasts.
- Fully Adjustable Inputs: Modify WACC, tax rates, revenue growth, and EBITDA margins to suit your analysis.
- Instant Results: Watch Asian Paints Limited's intrinsic value update in real time.
- Clear Visual Outputs: Dashboard charts showcase valuation results and essential metrics.
- Built for Accuracy: A professional-grade tool designed for analysts, investors, and finance professionals.
How It Operates
- Step 1: Download the Excel spreadsheet.
- Step 2: Examine the pre-filled Asian Paints Limited data (historical and forecasted).
- Step 3: Modify key assumptions (yellow cells) according to your analysis.
- Step 4: Observe automatic recalculations for Asian Paints Limited’s intrinsic value.
- Step 5: Utilize the results for investment decisions or reporting.
Why Choose This Calculator for Asian Paints Limited?
- Accurate Data: Up-to-date financial information for Asian Paints Limited guarantees trustworthy valuation outcomes.
- Customizable: Tailor critical parameters such as growth rates, WACC, and tax rates to align with your forecasts.
- Time-Saving: Built-in calculations save you the hassle of starting from square one.
- Professional-Grade Tool: Crafted for investors, analysts, and consultants in the industry.
- User-Friendly: An intuitive design and clear step-by-step guidance ensure ease of use for everyone.
Who Should Utilize This Product?
- Investors: Effectively evaluate the fair value of Asian Paints Limited (ASIANPAINTNS) prior to making investment choices.
- CFOs: Employ a high-quality DCF model for comprehensive financial reporting and analysis.
- Consultants: Quickly customize the template for client-focused valuation reports.
- Entrepreneurs: Acquire insights into the financial modeling strategies used by leading corporations.
- Educators: Utilize it as an educational resource to illustrate various valuation techniques.
Contents of the Template
- Pre-Filled Data: Contains Asian Paints Limited's historical financials and projections.
- Discounted Cash Flow Model: Editable DCF valuation model featuring automatic calculations.
- Weighted Average Cost of Capital (WACC): A specific sheet for calculating WACC based on user-defined inputs.
- Key Financial Ratios: Evaluate Asian Paints Limited's profitability, efficiency, and leverage metrics.
- Customizable Inputs: Easily modify revenue growth rates, profit margins, and tax rates.
- Clear Dashboard: Visual representations and tables summarizing essential valuation outcomes.
Disclaimer
All information, articles, and product details provided on this website are for general informational and educational purposes only. We do not claim any ownership over, nor do we intend to infringe upon, any trademarks, copyrights, logos, brand names, or other intellectual property mentioned or depicted on this site. Such intellectual property remains the property of its respective owners, and any references here are made solely for identification or informational purposes, without implying any affiliation, endorsement, or partnership.
We make no representations or warranties, express or implied, regarding the accuracy, completeness, or suitability of any content or products presented. Nothing on this website should be construed as legal, tax, investment, financial, medical, or other professional advice. In addition, no part of this site—including articles or product references—constitutes a solicitation, recommendation, endorsement, advertisement, or offer to buy or sell any securities, franchises, or other financial instruments, particularly in jurisdictions where such activity would be unlawful.
All content is of a general nature and may not address the specific circumstances of any individual or entity. It is not a substitute for professional advice or services. Any actions you take based on the information provided here are strictly at your own risk. You accept full responsibility for any decisions or outcomes arising from your use of this website and agree to release us from any liability in connection with your use of, or reliance upon, the content or products found herein.