
|
ASTER DM Healthcare Limited (Asterdm.NS) Évaluation DCF |
Entièrement Modifiable: Adapté À Vos Besoins Dans Excel Ou Sheets
Conception Professionnelle: Modèles Fiables Et Conformes Aux Normes Du Secteur
Pré-Construits Pour Une Utilisation Rapide Et Efficace
Compatible MAC/PC, entièrement débloqué
Aucune Expertise N'Est Requise; Facile À Suivre
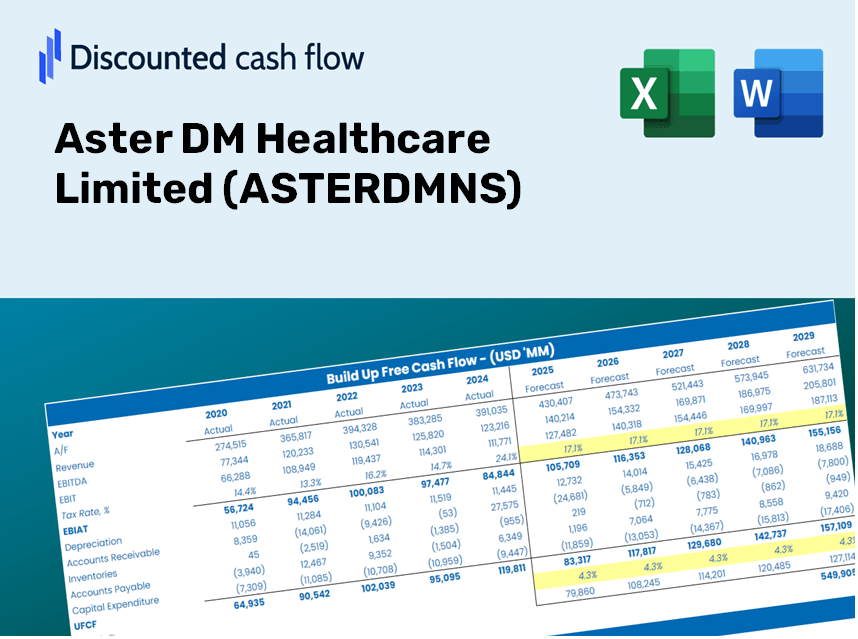
Aster DM Healthcare Limited (ASTERDM.NS) Bundle
Simplifiez Aster DM Healthcare Limited Valuation avec cette calculatrice DCF personnalisable! Doté de la véritable valeur financière Aster DM Healthcare Limited et des intrants de prévision ajustés, vous pouvez tester les scénarios et découvrir la juste valeur d'Aster DM Healthcare Limited en procès-verbal.
Discounted Cash Flow (DCF) - (USD MM)
| Year | AY1 2021 |
AY2 2022 |
AY3 2023 |
AY4 2024 |
AY5 2025 |
FY1 2026 |
FY2 2027 |
FY3 2028 |
FY4 2029 |
FY5 2030 |
|---|---|---|---|---|---|---|---|---|---|---|
| Revenue | 86,084.3 | 102,532.8 | 29,940.5 | 36,989.0 | 41,384.6 | 39,701.6 | 38,087.1 | 36,538.3 | 35,052.4 | 33,627.0 |
| Revenue Growth, % | 0 | 19.11 | -70.8 | 23.54 | 11.88 | -4.07 | -4.07 | -4.07 | -4.07 | -4.07 |
| EBITDA | 8,071.2 | 12,110.2 | 4,101.3 | 5,329.5 | 7,059.0 | 5,268.5 | 5,054.2 | 4,848.7 | 4,651.5 | 4,462.3 |
| EBITDA, % | 9.38 | 11.81 | 13.7 | 14.41 | 17.06 | 13.27 | 13.27 | 13.27 | 13.27 | 13.27 |
| Depreciation | 3,596.1 | 3,670.9 | 1,530.9 | 1,747.4 | 1,892.5 | 1,760.2 | 1,688.6 | 1,619.9 | 1,554.1 | 1,490.9 |
| Depreciation, % | 4.18 | 3.58 | 5.11 | 4.72 | 4.57 | 4.43 | 4.43 | 4.43 | 4.43 | 4.43 |
| EBIT | 4,475.1 | 8,439.3 | 2,570.4 | 3,582.1 | 5,166.5 | 3,508.3 | 3,365.6 | 3,228.7 | 3,097.4 | 2,971.5 |
| EBIT, % | 5.2 | 8.23 | 8.59 | 9.68 | 12.48 | 8.84 | 8.84 | 8.84 | 8.84 | 8.84 |
| Total Cash | 3,058.5 | 3,694.8 | 3,964.7 | 1,105.7 | 13,814.2 | 4,507.5 | 4,324.2 | 4,148.4 | 3,979.7 | 3,817.9 |
| Total Cash, percent | .0 | .0 | .0 | .0 | .0 | .0 | .0 | .0 | .0 | .0 |
| Account Receivables | 21,067.7 | 20,608.7 | 23,858.0 | 2,646.4 | 2,578.1 | 10,929.2 | 10,484.8 | 10,058.4 | 9,649.4 | 9,257.0 |
| Account Receivables, % | 24.47 | 20.1 | 79.68 | 7.15 | 6.23 | 27.53 | 27.53 | 27.53 | 27.53 | 27.53 |
| Inventories | 8,681.4 | 10,256.8 | 14,124.7 | 1,375.7 | 923.5 | 5,813.5 | 5,577.1 | 5,350.3 | 5,132.7 | 4,924.0 |
| Inventories, % | 10.08 | 10 | 47.18 | 3.72 | 2.23 | 14.64 | 14.64 | 14.64 | 14.64 | 14.64 |
| Accounts Payable | 20,273.4 | 21,180.9 | 29,877.7 | 4,587.0 | 4,262.0 | 13,236.4 | 12,698.1 | 12,181.7 | 11,686.3 | 11,211.1 |
| Accounts Payable, % | 23.55 | 20.66 | 99.79 | 12.4 | 10.3 | 33.34 | 33.34 | 33.34 | 33.34 | 33.34 |
| Capital Expenditure | -4,236.5 | -5,479.7 | -8,482.3 | -7,969.1 | -3,460.4 | -5,439.3 | -5,218.1 | -5,005.9 | -4,802.3 | -4,607.0 |
| Capital Expenditure, % | -4.92 | -5.34 | -28.33 | -21.54 | -8.36 | -13.7 | -13.7 | -13.7 | -13.7 | -13.7 |
| Tax Rate, % | -1041.64 | -1041.64 | -1041.64 | -1041.64 | -1041.64 | -1041.64 | -1041.64 | -1041.64 | -1041.64 | -1041.64 |
| EBITAT | 3,224.3 | 6,970.2 | 5,587.8 | 1,773.0 | 58,983.1 | 2,835.6 | 2,720.3 | 2,609.7 | 2,503.6 | 2,401.8 |
| Depreciation | ||||||||||
| Changes in Account Receivables | ||||||||||
| Changes in Inventories | ||||||||||
| Changes in Accounts Payable | ||||||||||
| Capital Expenditure | ||||||||||
| UFCF | -6,891.8 | 4,952.5 | 216.0 | 4,221.2 | 57,610.7 | -5,110.2 | -666.6 | -639.5 | -613.5 | -588.5 |
| WACC, % | 4.53 | 4.56 | 4.62 | 4.45 | 4.62 | 4.56 | 4.56 | 4.56 | 4.56 | 4.56 |
| PV UFCF | ||||||||||
| SUM PV UFCF | -7,040.9 | |||||||||
| Long Term Growth Rate, % | 4.00 | |||||||||
| Free cash flow (T + 1) | -612 | |||||||||
| Terminal Value | -109,848 | |||||||||
| Present Terminal Value | -87,906 | |||||||||
| Enterprise Value | -94,947 | |||||||||
| Net Debt | 6,378 | |||||||||
| Equity Value | -101,325 | |||||||||
| Diluted Shares Outstanding, MM | 499 | |||||||||
| Equity Value Per Share | -203.22 |
Benefits of Choosing Aster DM Healthcare Limited
- Customizable Excel Template: A fully adaptable Excel-based DCF Calculator featuring pre-populated financial data for Aster DM Healthcare Limited (ASTERDMNS).
- Accurate Market Data: Access to historical performance and future projections (highlighted in the yellow cells).
- Flexible Forecasting: Modify key assumptions such as revenue growth, EBITDA margin, and WACC as needed.
- Instant Calculations: Quickly observe how your inputs affect the valuation of Aster DM Healthcare Limited (ASTERDMNS).
- Professional-Grade Tool: Designed for use by investors, CFOs, consultants, and financial analysts.
- Intuitive User Experience: Organized for ease of understanding and navigation, complete with step-by-step guidance.
Key Features
- Pre-Loaded Data: Aster DM Healthcare's historical financial statements and pre-filled forecasts.
- Fully Adjustable Inputs: Customize WACC, tax rates, revenue growth, and EBITDA margins.
- Instant Results: Watch Aster DM Healthcare's intrinsic value update in real time.
- Clear Visual Outputs: Dashboard charts showcase valuation results and key metrics.
- Built for Accuracy: A professional tool tailored for analysts, investors, and finance professionals.
How It Works
- Step 1: Download the Excel file for Aster DM Healthcare Limited (ASTERDMNS).
- Step 2: Review the pre-filled financial data and forecasts for Aster DM Healthcare.
- Step 3: Adjust key inputs such as revenue growth, WACC, and tax rates (highlighted cells).
- Step 4: Observe how the DCF model updates in real time as you modify your assumptions.
- Step 5: Evaluate the outputs and apply the findings to inform your investment strategies.
Why Opt for Aster DM Healthcare Limited's Calculator?
- Time Efficient: Skip the hassle of building a DCF model from the ground up – it's ready for immediate use.
- Enhanced Precision: Dependable financial data and formulas minimize valuation errors.
- Fully Adaptable: Modify the model to align with your unique assumptions and forecasts.
- User-Friendly Results: Intuitive charts and outputs simplify the analysis process.
- Preferred by Professionals: Crafted for experts who prioritize accuracy and functionality.
Who Can Benefit from Aster DM Healthcare Limited (ASTERDMNS)?
- Healthcare Students: Explore healthcare valuation techniques and apply them using actual data.
- Researchers: Utilize established models in your studies or academic projects.
- Investors: Validate your investment strategies and examine valuation forecasts for Aster DM Healthcare Limited (ASTERDMNS).
- Financial Analysts: Enhance your analysis process with a customizable DCF model tailored to the healthcare sector.
- Healthcare Entrepreneurs: Discover how large healthcare corporations like Aster DM Healthcare Limited (ASTERDMNS) are evaluated in the market.
Contents of the Template
- Operating and Balance Sheet Data: Pre-filled historical data and forecasts for Aster DM Healthcare Limited (ASTERDMNS), including revenue, EBITDA, EBIT, and capital expenditures.
- WACC Calculation: A dedicated sheet for calculating the Weighted Average Cost of Capital (WACC), featuring inputs such as Beta, risk-free rate, and share price.
- DCF Valuation (Unlevered and Levered): Customizable Discounted Cash Flow models that present intrinsic value with comprehensive calculations.
- Financial Statements: Pre-loaded annual and quarterly financial statements to facilitate thorough analysis.
- Key Ratios: A range of metrics, including profitability, leverage, and efficiency ratios specific to Aster DM Healthcare Limited (ASTERDMNS).
- Dashboard and Charts: A visual overview of valuation results and key assumptions to streamline analysis.
Disclaimer
All information, articles, and product details provided on this website are for general informational and educational purposes only. We do not claim any ownership over, nor do we intend to infringe upon, any trademarks, copyrights, logos, brand names, or other intellectual property mentioned or depicted on this site. Such intellectual property remains the property of its respective owners, and any references here are made solely for identification or informational purposes, without implying any affiliation, endorsement, or partnership.
We make no representations or warranties, express or implied, regarding the accuracy, completeness, or suitability of any content or products presented. Nothing on this website should be construed as legal, tax, investment, financial, medical, or other professional advice. In addition, no part of this site—including articles or product references—constitutes a solicitation, recommendation, endorsement, advertisement, or offer to buy or sell any securities, franchises, or other financial instruments, particularly in jurisdictions where such activity would be unlawful.
All content is of a general nature and may not address the specific circumstances of any individual or entity. It is not a substitute for professional advice or services. Any actions you take based on the information provided here are strictly at your own risk. You accept full responsibility for any decisions or outcomes arising from your use of this website and agree to release us from any liability in connection with your use of, or reliance upon, the content or products found herein.