|
Adtalem Global Education Inc. (ATGE) Évaluation DCF |
Entièrement Modifiable: Adapté À Vos Besoins Dans Excel Ou Sheets
Conception Professionnelle: Modèles Fiables Et Conformes Aux Normes Du Secteur
Pré-Construits Pour Une Utilisation Rapide Et Efficace
Compatible MAC/PC, entièrement débloqué
Aucune Expertise N'Est Requise; Facile À Suivre
Adtalem Global Education Inc. (ATGE) Bundle
Vous cherchez à évaluer la valeur intrinsèque d'Adtalem Global Education Inc.? Notre calculatrice (ATGE) DCF intègre des données réelles avec des fonctionnalités de personnalisation étendues, vous permettant d'affiner vos prévisions et d'améliorer votre stratégie d'investissement.
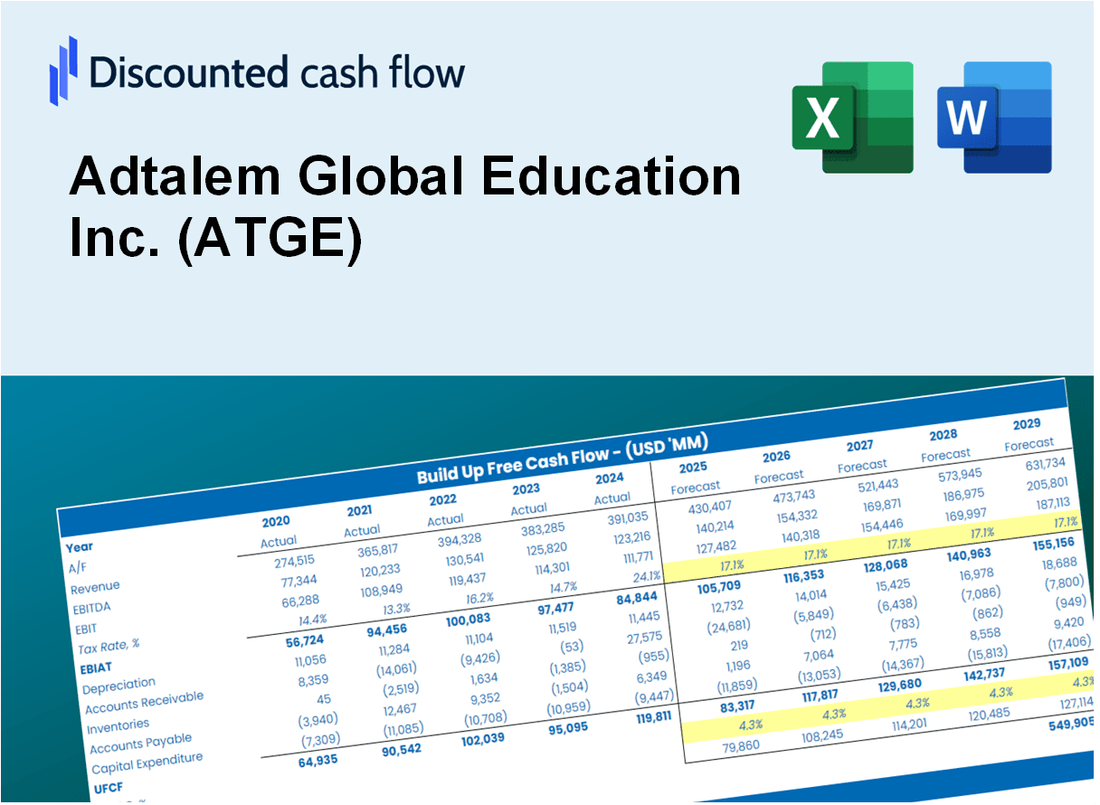
Discounted Cash Flow (DCF) - (USD MM)
| Year | AY1 2021 |
AY2 2022 |
AY3 2023 |
AY4 2024 |
AY5 2025 |
FY1 2026 |
FY2 2027 |
FY3 2028 |
FY4 2029 |
FY5 2030 |
|---|---|---|---|---|---|---|---|---|---|---|
| Revenue | 899.2 | 1,387.1 | 1,450.8 | 1,584.7 | 1,788.3 | 2,150.1 | 2,585.0 | 3,108.0 | 3,736.7 | 4,492.7 |
| Revenue Growth, % | 0 | 54.25 | 4.59 | 9.22 | 12.85 | 20.23 | 20.23 | 20.23 | 20.23 | 20.23 |
| EBITDA | 210.8 | 264.5 | 326.3 | 335.6 | 435.3 | 475.2 | 571.4 | 686.9 | 825.9 | 993.0 |
| EBITDA, % | 23.44 | 19.06 | 22.49 | 21.18 | 24.34 | 22.1 | 22.1 | 22.1 | 22.1 | 22.1 |
| Depreciation | 84.5 | 186.6 | 151.3 | 108.0 | 84.5 | 192.7 | 231.7 | 278.6 | 334.9 | 402.7 |
| Depreciation, % | 9.4 | 13.45 | 10.43 | 6.81 | 4.72 | 8.96 | 8.96 | 8.96 | 8.96 | 8.96 |
| EBIT | 126.3 | 77.9 | 175.0 | 227.6 | 350.8 | 282.5 | 339.7 | 408.4 | 491.0 | 590.3 |
| EBIT, % | 14.04 | 5.61 | 12.06 | 14.36 | 19.62 | 13.14 | 13.14 | 13.14 | 13.14 | 13.14 |
| Total Cash | 476.4 | 347.0 | 272.2 | 219.3 | 199.6 | 523.5 | 629.5 | 756.8 | 909.9 | 1,094.0 |
| Total Cash, percent | .0 | .0 | .0 | .0 | .0 | .0 | .0 | .0 | .0 | .0 |
| Account Receivables | 43.0 | 81.6 | 102.7 | 126.8 | 146.2 | 145.9 | 175.4 | 210.9 | 253.6 | 304.9 |
| Account Receivables, % | 4.79 | 5.89 | 7.08 | 8 | 8.17 | 6.79 | 6.79 | 6.79 | 6.79 | 6.79 |
| Inventories | .0 | .0 | 1.4 | .0 | .0 | .4 | .5 | .6 | .7 | .9 |
| Inventories, % | 0 | 0 | 0.09553179 | 0 | 0 | 0.01910636 | 0.01910636 | 0.01910636 | 0.01910636 | 0.01910636 |
| Accounts Payable | 42.4 | 57.1 | 81.8 | 102.6 | 105.0 | 115.3 | 138.7 | 166.7 | 200.5 | 241.0 |
| Accounts Payable, % | 4.72 | 4.12 | 5.64 | 6.48 | 5.87 | 5.36 | 5.36 | 5.36 | 5.36 | 5.36 |
| Capital Expenditure | -48.7 | -31.1 | -37.0 | -48.9 | -50.3 | -69.2 | -83.2 | -100.1 | -120.3 | -144.7 |
| Capital Expenditure, % | -5.41 | -2.24 | -2.55 | -3.09 | -2.81 | -3.22 | -3.22 | -3.22 | -3.22 | -3.22 |
| Tax Rate, % | 20.58 | 20.58 | 20.58 | 20.58 | 20.58 | 20.58 | 20.58 | 20.58 | 20.58 | 20.58 |
| EBITAT | 116.7 | -470.2 | 145.8 | 189.9 | 278.6 | 191.3 | 230.0 | 276.5 | 332.5 | 399.8 |
| Depreciation | ||||||||||
| Changes in Account Receivables | ||||||||||
| Changes in Inventories | ||||||||||
| Changes in Accounts Payable | ||||||||||
| Capital Expenditure | ||||||||||
| UFCF | 151.9 | -338.5 | 262.3 | 247.1 | 295.8 | 325.0 | 372.2 | 447.5 | 538.0 | 646.9 |
| WACC, % | 6.98 | 5.9 | 6.87 | 6.88 | 6.83 | 6.69 | 6.69 | 6.69 | 6.69 | 6.69 |
| PV UFCF | ||||||||||
| SUM PV UFCF | 1,883.3 | |||||||||
| Long Term Growth Rate, % | 3.00 | |||||||||
| Free cash flow (T + 1) | 666 | |||||||||
| Terminal Value | 18,051 | |||||||||
| Present Terminal Value | 13,057 | |||||||||
| Enterprise Value | 14,940 | |||||||||
| Net Debt | 574 | |||||||||
| Equity Value | 14,366 | |||||||||
| Diluted Shares Outstanding, MM | 38 | |||||||||
| Equity Value Per Share | 374.76 |
What You Will Get
- Comprehensive ATGE Financials: Access both historical and projected data for precise valuation.
- Customizable Inputs: Adjust WACC, tax rates, revenue growth, and capital expenditures as needed.
- Real-Time Calculations: Intrinsic value and NPV are computed automatically.
- Scenario Analysis: Evaluate various scenarios to assess Adtalem's future performance.
- User-Friendly Interface: Designed for industry professionals while remaining approachable for newcomers.
Key Features
- Comprehensive Data: Adtalem Global Education Inc.'s historical financial statements and pre-filled forecasts.
- Customizable Inputs: Adjust WACC, tax rates, revenue growth, and EBITDA margins as needed.
- Real-Time Insights: Observe Adtalem's intrinsic value recalculating instantly.
- Intuitive Visuals: Dashboard charts present valuation outcomes and essential metrics clearly.
- Designed for Precision: A reliable tool tailored for analysts, investors, and finance professionals.
How It Works
- Step 1: Download the prebuilt Excel template featuring Adtalem Global Education Inc.'s (ATGE) data.
- Step 2: Navigate through the pre-filled sheets to familiarize yourself with the essential metrics.
- Step 3: Modify forecasts and assumptions in the editable yellow cells (WACC, growth, margins).
- Step 4: Instantly see the recalculated results, including Adtalem Global Education Inc.'s (ATGE) intrinsic value.
- Step 5: Utilize the outputs to make informed investment decisions or create detailed reports.
Why Choose This Calculator for Adtalem Global Education Inc. (ATGE)?
- All-in-One Solution: Features DCF, WACC, and a range of financial ratio analyses tailored for Adtalem Global Education Inc. (ATGE).
- Flexible Parameters: Modify yellow-highlighted fields to explore different financial scenarios.
- In-Depth Analysis: Automatically computes Adtalem’s intrinsic value and Net Present Value.
- Preloaded Information: Incorporates historical and projected data for precise calculations.
- Expert-Level Tool: Perfect for financial analysts, investors, and educational consultants focused on Adtalem Global Education Inc. (ATGE).
Who Should Use This Product?
- Education Professionals: Explore innovative teaching methods and integrate them into your curriculum.
- Students: Gain practical experience in the education sector and enhance your learning with real-world applications.
- Investors: Evaluate educational trends and assess the performance of Adtalem Global Education Inc. (ATGE).
- Researchers: Utilize comprehensive data to support studies in educational outcomes and market analysis.
- Career Advisors: Understand the educational landscape to better guide students in their career paths.
What the Template Contains
- Comprehensive DCF Model: Editable template featuring detailed valuation calculations tailored for Adtalem Global Education Inc. (ATGE).
- Real-World Data: Adtalem’s historical and projected financials preloaded for thorough analysis.
- Customizable Parameters: Modify WACC, growth rates, and tax assumptions to explore various scenarios.
- Financial Statements: Complete annual and quarterly breakdowns for enhanced insights.
- Key Ratios: Integrated analysis for profitability, efficiency, and leverage metrics.
- Dashboard with Visual Outputs: Charts and tables designed for clear, actionable results.
Disclaimer
All information, articles, and product details provided on this website are for general informational and educational purposes only. We do not claim any ownership over, nor do we intend to infringe upon, any trademarks, copyrights, logos, brand names, or other intellectual property mentioned or depicted on this site. Such intellectual property remains the property of its respective owners, and any references here are made solely for identification or informational purposes, without implying any affiliation, endorsement, or partnership.
We make no representations or warranties, express or implied, regarding the accuracy, completeness, or suitability of any content or products presented. Nothing on this website should be construed as legal, tax, investment, financial, medical, or other professional advice. In addition, no part of this site—including articles or product references—constitutes a solicitation, recommendation, endorsement, advertisement, or offer to buy or sell any securities, franchises, or other financial instruments, particularly in jurisdictions where such activity would be unlawful.
All content is of a general nature and may not address the specific circumstances of any individual or entity. It is not a substitute for professional advice or services. Any actions you take based on the information provided here are strictly at your own risk. You accept full responsibility for any decisions or outcomes arising from your use of this website and agree to release us from any liability in connection with your use of, or reliance upon, the content or products found herein.