
|
Adani Total Gas Limited (ATGL.NS) Évaluation DCF |
Entièrement Modifiable: Adapté À Vos Besoins Dans Excel Ou Sheets
Conception Professionnelle: Modèles Fiables Et Conformes Aux Normes Du Secteur
Pré-Construits Pour Une Utilisation Rapide Et Efficace
Compatible MAC/PC, entièrement débloqué
Aucune Expertise N'Est Requise; Facile À Suivre
Adani Total Gas Limited (ATGL.NS) Bundle
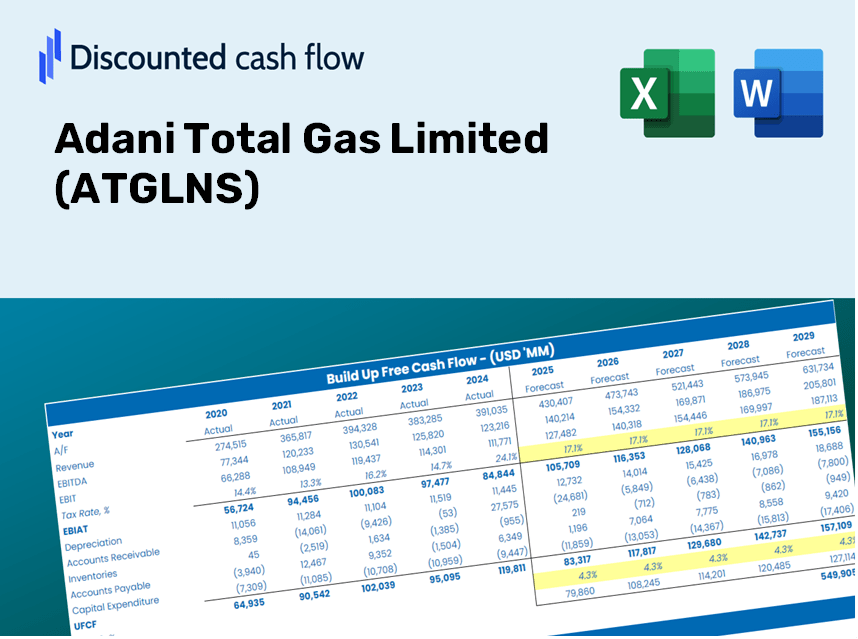
Gardez un aperçu de votre analyse d'évaluation Adani Total Gas Limited (ATGLNS) avec notre calculatrice sophistiquée DCF! Équipée de données réelles (ATGLNS), ce modèle Excel vous permet d'ajuster les prévisions et les hypothèses pour déterminer la valeur intrinsèque d'Adani Total Gas Limited (ATGLNS) avec précision.
Discounted Cash Flow (DCF) - (USD MM)
| Year | AY1 2021 |
AY2 2022 |
AY3 2023 |
AY4 2024 |
AY5 2025 |
FY1 2026 |
FY2 2027 |
FY3 2028 |
FY4 2029 |
FY5 2030 |
|---|---|---|---|---|---|---|---|---|---|---|
| Revenue | 16,956.2 | 30,384.1 | 43,784.0 | 44,747.4 | 49,998.6 | 67,151.7 | 90,189.6 | 121,131.2 | 162,688.0 | 218,501.7 |
| Revenue Growth, % | 0 | 79.19 | 44.1 | 2.2 | 11.74 | 34.31 | 34.31 | 34.31 | 34.31 | 34.31 |
| EBITDA | 6,962.8 | 7,644.7 | 8,608.6 | 10,843.3 | 11,200.2 | 17,797.7 | 23,903.6 | 32,104.2 | 43,118.3 | 57,911.0 |
| EBITDA, % | 41.06 | 25.16 | 19.66 | 24.23 | 22.4 | 26.5 | 26.5 | 26.5 | 26.5 | 26.5 |
| Depreciation | 544.6 | 735.8 | 1,038.1 | 1,384.7 | 1,856.6 | 1,989.3 | 2,671.8 | 3,588.4 | 4,819.5 | 6,473.0 |
| Depreciation, % | 3.21 | 2.42 | 2.37 | 3.09 | 3.71 | 2.96 | 2.96 | 2.96 | 2.96 | 2.96 |
| EBIT | 6,418.2 | 6,908.9 | 7,570.5 | 9,458.6 | 9,343.6 | 15,808.4 | 21,231.8 | 28,515.8 | 38,298.8 | 51,438.0 |
| EBIT, % | 37.85 | 22.74 | 17.29 | 21.14 | 18.69 | 23.54 | 23.54 | 23.54 | 23.54 | 23.54 |
| Total Cash | 102.6 | 312.7 | 521.8 | 1,413.2 | 3,221.5 | 1,669.0 | 2,241.6 | 3,010.7 | 4,043.6 | 5,430.8 |
| Total Cash, percent | .0 | .0 | .0 | .0 | .0 | .0 | .0 | .0 | .0 | .0 |
| Account Receivables | 1,206.1 | 2,233.9 | 3,230.7 | 4,297.2 | 4,373.3 | 5,398.2 | 7,250.2 | 9,737.5 | 13,078.2 | 17,564.9 |
| Account Receivables, % | 7.11 | 7.35 | 7.38 | 9.6 | 8.75 | 8.04 | 8.04 | 8.04 | 8.04 | 8.04 |
| Inventories | 520.1 | 767.8 | 909.6 | 991.7 | 1,156.6 | 1,638.7 | 2,200.9 | 2,955.9 | 3,970.0 | 5,332.0 |
| Inventories, % | 3.07 | 2.53 | 2.08 | 2.22 | 2.31 | 2.44 | 2.44 | 2.44 | 2.44 | 2.44 |
| Accounts Payable | 324.1 | 673.7 | 4,437.1 | 4,437.1 | 3,138.0 | 4,090.2 | 5,493.4 | 7,378.1 | 9,909.3 | 13,308.9 |
| Accounts Payable, % | 1.91 | 2.22 | 10.13 | 9.92 | 6.28 | 6.09 | 6.09 | 6.09 | 6.09 | 6.09 |
| Capital Expenditure | -6,064.3 | -9,506.1 | -11,753.7 | -7,993.2 | -9,409.2 | -17,537.0 | -23,553.5 | -31,634.0 | -42,486.8 | -57,062.8 |
| Capital Expenditure, % | -35.76 | -31.29 | -26.84 | -17.86 | -18.82 | -26.12 | -26.12 | -26.12 | -26.12 | -26.12 |
| Tax Rate, % | 25.2 | 25.2 | 25.2 | 25.2 | 25.2 | 25.2 | 25.2 | 25.2 | 25.2 | 25.2 |
| EBITAT | 4,775.1 | 5,147.0 | 5,647.7 | 7,044.0 | 6,989.4 | 11,785.9 | 15,829.3 | 21,259.9 | 28,553.6 | 38,349.6 |
| Depreciation | ||||||||||
| Changes in Account Receivables | ||||||||||
| Changes in Inventories | ||||||||||
| Changes in Accounts Payable | ||||||||||
| Capital Expenditure | ||||||||||
| UFCF | -2,146.7 | -4,549.2 | -2,443.1 | -713.1 | -2,103.3 | -4,316.6 | -6,063.3 | -8,143.4 | -10,937.2 | -14,689.4 |
| WACC, % | 6.37 | 6.37 | 6.37 | 6.37 | 6.37 | 6.37 | 6.37 | 6.37 | 6.37 | 6.37 |
| PV UFCF | ||||||||||
| SUM PV UFCF | -35,513.0 | |||||||||
| Long Term Growth Rate, % | 2.00 | |||||||||
| Free cash flow (T + 1) | -14,983 | |||||||||
| Terminal Value | -342,822 | |||||||||
| Present Terminal Value | -251,746 | |||||||||
| Enterprise Value | -287,259 | |||||||||
| Net Debt | 13,654 | |||||||||
| Equity Value | -300,912 | |||||||||
| Diluted Shares Outstanding, MM | 1,100 | |||||||||
| Equity Value Per Share | -273.60 |
What You Will Receive
- Authentic ATGLNS Financial Data: Pre-filled with Adani Total Gas Limited's historical and forecasted figures for comprehensive analysis.
- Completely Customizable Template: Easily adjust key parameters such as revenue growth, WACC, and EBITDA margins.
- Instant Calculations: Witness real-time updates of Adani Total Gas Limited’s intrinsic value as you modify inputs.
- Expert Valuation Tool: Tailored for investors, analysts, and consultants aiming for precise DCF outcomes.
- Intuitive Design: Streamlined layout and straightforward guidance suitable for users of all skill levels.
Essential Features of Adani Total Gas Limited (ATGLNS)
- Verified Financial Data: Gain access to reliable historical financials and future forecasts that are pre-loaded.
- Adjustable Assumptions: Modify the highlighted cells, including WACC, growth rates, and profit margins, to tailor your projections.
- Real-Time Calculations: Receive instant updates on DCF, Net Present Value (NPV), and cash flow assessments.
- User-Friendly Dashboard: Utilize clear charts and summaries to easily interpret your valuation findings.
- Suitable for All Skill Levels: Designed with a straightforward layout for investors, CFOs, and consultants alike.
How It Operates
- Download the Template: Gain immediate access to the Excel-based ATGLNS DCF Calculator.
- Input Your Assumptions: Modify the yellow-highlighted cells for growth rates, WACC, margins, and other variables.
- Instant Calculations: The model automatically recalculates Adani Total Gas Limited’s intrinsic value.
- Test Scenarios: Experiment with various assumptions to assess potential changes in valuation.
- Analyze and Decide: Utilize the outcomes to inform your investment or financial evaluations.
Why Select This Calculator?
- Precision: Utilizes real Adani Total Gas Limited (ATGLNS) financial data for reliable results.
- Versatility: Built to allow users to easily test and adjust parameters as needed.
- Efficiency: Avoid the complications of creating a DCF model from the ground up.
- Expert-Level: Crafted with a focus on accuracy and usability for finance professionals.
- Intuitive Design: Simple to navigate, making it accessible for users with varying levels of financial expertise.
Who Can Benefit from This Product?
- Finance Students: Discover valuation methodologies and apply them with actual data for Adani Total Gas Limited (ATGLNS).
- Academics: Integrate industry-standard models into your teaching or research related to Adani Total Gas Limited (ATGLNS).
- Investors: Evaluate your hypotheses and assess valuation results for Adani Total Gas Limited (ATGLNS).
- Analysts: Optimize your process with a ready-made, customizable DCF model tailored for Adani Total Gas Limited (ATGLNS).
- Small Business Owners: Understand the analysis methods used for large public entities like Adani Total Gas Limited (ATGLNS).
Contents of the Template for Adani Total Gas Limited (ATGLNS)
- Preloaded ATGLNS Data: Historical and projected financial metrics, including revenue, EBIT, and capital expenditures.
- DCF and WACC Models: Advanced sheets for determining intrinsic value and the Weighted Average Cost of Capital.
- Editable Inputs: Yellow-highlighted cells for modifying revenue growth, tax rates, and discount rates.
- Financial Statements: Detailed annual and quarterly financial statements for in-depth analysis.
- Key Ratios: Metrics for profitability, leverage, and efficiency to assess performance.
- Dashboard and Charts: Visual representations of valuation results and underlying assumptions.
Disclaimer
All information, articles, and product details provided on this website are for general informational and educational purposes only. We do not claim any ownership over, nor do we intend to infringe upon, any trademarks, copyrights, logos, brand names, or other intellectual property mentioned or depicted on this site. Such intellectual property remains the property of its respective owners, and any references here are made solely for identification or informational purposes, without implying any affiliation, endorsement, or partnership.
We make no representations or warranties, express or implied, regarding the accuracy, completeness, or suitability of any content or products presented. Nothing on this website should be construed as legal, tax, investment, financial, medical, or other professional advice. In addition, no part of this site—including articles or product references—constitutes a solicitation, recommendation, endorsement, advertisement, or offer to buy or sell any securities, franchises, or other financial instruments, particularly in jurisdictions where such activity would be unlawful.
All content is of a general nature and may not address the specific circumstances of any individual or entity. It is not a substitute for professional advice or services. Any actions you take based on the information provided here are strictly at your own risk. You accept full responsibility for any decisions or outcomes arising from your use of this website and agree to release us from any liability in connection with your use of, or reliance upon, the content or products found herein.