
|
Auto Trader Group PLC (Auto.L) Évaluation DCF |
Entièrement Modifiable: Adapté À Vos Besoins Dans Excel Ou Sheets
Conception Professionnelle: Modèles Fiables Et Conformes Aux Normes Du Secteur
Pré-Construits Pour Une Utilisation Rapide Et Efficace
Compatible MAC/PC, entièrement débloqué
Aucune Expertise N'Est Requise; Facile À Suivre
Auto Trader Group plc (AUTO.L) Bundle
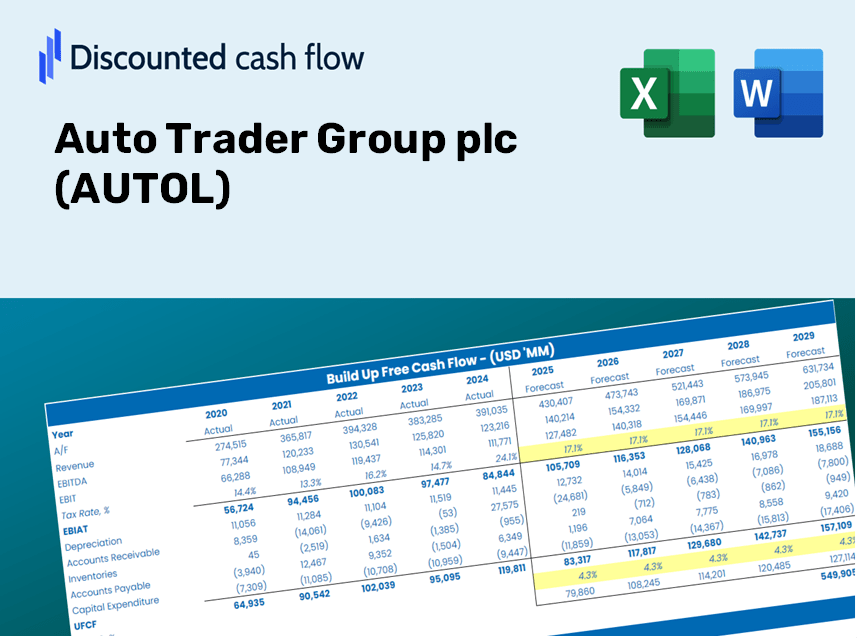
Évaluez les perspectives financières de Auto Trader Group PLC comme un expert! Cette calculatrice AUTOL DCF est livrée avec des données financières pré-remplies et offre une pleine flexibilité pour modifier la croissance des revenus, le WACC, les marges et d'autres hypothèses critiques pour s'aligner sur vos prévisions.
Benefits You Will Enjoy
- Pre-Filled Financial Model: Utilize Auto Trader Group plc’s (AUTOL) actual data for accurate DCF valuations.
- Comprehensive Forecast Control: Modify revenue growth, profit margins, WACC, and other essential variables.
- Immediate Calculations: Real-time updates provide instant results as you make adjustments.
- Professional-Grade Template: An expertly crafted Excel file tailored for high-quality valuation analysis.
- Flexible and Reusable: Designed for customization, allowing for multiple uses in detailed forecasting.
Key Features
- Pre-Loaded Data: Historical financial statements and pre-filled forecasts for Auto Trader Group plc (AUTOL).
- Fully Adjustable Inputs: Customize assumptions for WACC, tax rates, revenue growth, and EBITDA margins.
- Instant Results: Watch the intrinsic value of Auto Trader Group plc (AUTOL) update in real time.
- Clear Visual Outputs: Interactive dashboard charts showcase valuation results and essential metrics.
- Built for Accuracy: A professional-grade tool tailored for analysts, investors, and financial professionals.
How It Functions
- Download the Template: Gain immediate access to the Excel-based AUTOL DCF Calculator.
- Input Your Assumptions: Modify the yellow-highlighted cells for growth rates, WACC, margins, and other parameters.
- Instant Calculations: The model automatically refreshes Auto Trader Group's intrinsic value.
- Test Scenarios: Experiment with different assumptions to assess potential changes in valuation.
- Analyze and Decide: Use the insights to inform your investment or financial analysis.
Why Opt for This Calculator?
- Reliable Data: Accurate Auto Trader Group financials provide dependable valuation outcomes.
- Flexible: Tailor essential inputs like growth projections, WACC, and tax rates to fit your forecasts.
- Time-Efficient: Pre-configured calculations save you the effort of starting from scratch.
- Professional-Quality Tool: Crafted for investors, analysts, and consultants alike.
- User-Friendly: An intuitive design and comprehensive guidance make it accessible for everyone.
Who Should Benefit from This Product?
- Investors: Accurately assess the fair value of Auto Trader Group plc (AUTOL) to inform your investment choices.
- CFOs: Utilize a high-caliber DCF model for comprehensive financial reporting and analysis.
- Consultants: Effortlessly customize the template for client valuation reports.
- Entrepreneurs: Discover insights into the financial modeling practices of leading companies.
- Educators: Implement this tool in the classroom to illustrate key valuation techniques.
Contents of the Template
- Historical Data: Features Auto Trader Group plc’s previous financial performance and foundational forecasts.
- DCF and Levered DCF Models: Comprehensive templates for assessing the intrinsic value of Auto Trader Group plc.
- WACC Sheet: Ready-to-use calculations for Weighted Average Cost of Capital.
- Editable Inputs: Customize essential parameters such as growth rates, EBITDA %, and CAPEX assumptions.
- Quarterly and Annual Statements: A thorough breakdown of Auto Trader Group plc’s financials.
- Interactive Dashboard: Dynamically visualize valuation outcomes and forecasts.
Disclaimer
All information, articles, and product details provided on this website are for general informational and educational purposes only. We do not claim any ownership over, nor do we intend to infringe upon, any trademarks, copyrights, logos, brand names, or other intellectual property mentioned or depicted on this site. Such intellectual property remains the property of its respective owners, and any references here are made solely for identification or informational purposes, without implying any affiliation, endorsement, or partnership.
We make no representations or warranties, express or implied, regarding the accuracy, completeness, or suitability of any content or products presented. Nothing on this website should be construed as legal, tax, investment, financial, medical, or other professional advice. In addition, no part of this site—including articles or product references—constitutes a solicitation, recommendation, endorsement, advertisement, or offer to buy or sell any securities, franchises, or other financial instruments, particularly in jurisdictions where such activity would be unlawful.
All content is of a general nature and may not address the specific circumstances of any individual or entity. It is not a substitute for professional advice or services. Any actions you take based on the information provided here are strictly at your own risk. You accept full responsibility for any decisions or outcomes arising from your use of this website and agree to release us from any liability in connection with your use of, or reliance upon, the content or products found herein.