
|
Avanti Feeds Limited (Avantifeed.NS) Évaluation DCF |
Entièrement Modifiable: Adapté À Vos Besoins Dans Excel Ou Sheets
Conception Professionnelle: Modèles Fiables Et Conformes Aux Normes Du Secteur
Pré-Construits Pour Une Utilisation Rapide Et Efficace
Compatible MAC/PC, entièrement débloqué
Aucune Expertise N'Est Requise; Facile À Suivre
Avanti Feeds Limited (AVANTIFEED.NS) Bundle
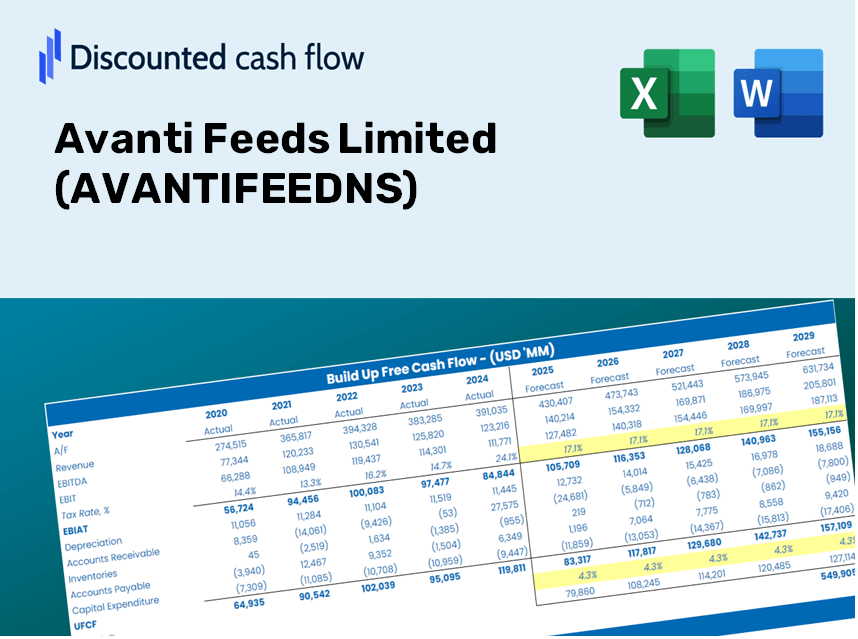
Que vous soyez un investisseur ou un analyste, cette calculatrice DCF Limited (Avantifeedns) Avanti Feeds Limited (Avantifeedns) est votre outil essentiel pour une évaluation précise. Chargé de données réelles d'Avanti Feeds Limited, vous pouvez ajuster les prévisions et observer les effets en temps réel.
What You Will Receive
- Authentic Avanti Feeds Data: Comprehensive financials – from revenue to EBIT – based on actual and projected metrics.
- Complete Customization: Modify all essential parameters (yellow cells) such as WACC, growth %, and tax rates.
- Immediate Valuation Updates: Automatic recalculations to assess the effects of changes on Avanti Feeds' fair value.
- Flexible Excel Template: Designed for quick adjustments, scenario analysis, and detailed forecasting.
- Efficient and Precise: Avoid the hassle of building models from the ground up while ensuring accuracy and adaptability.
Key Features
- Comprehensive DCF Calculator: Offers detailed unlevered and levered DCF valuation models tailored for Avanti Feeds Limited (AVANTIFEEDNS).
- WACC Estimator: Features a pre-designed Weighted Average Cost of Capital template with adjustable inputs.
- Customizable Forecast Assumptions: Allows users to alter growth rates, capital expenditures, and discount rates as needed.
- Integrated Financial Ratios: Evaluate profitability, leverage, and efficiency ratios specifically for Avanti Feeds Limited (AVANTIFEEDNS).
- Interactive Dashboard and Charts: Visual representations summarize essential valuation metrics for straightforward analysis.
How It Operates
- Step 1: Download the Excel file.
- Step 2: Review the pre-filled data for Avanti Feeds Limited (AVANTIFEEDNS) including historical and projected figures.
- Step 3: Modify key assumptions (highlighted in yellow) based on your insights.
- Step 4: Observe the automatic recalculations for the intrinsic value of Avanti Feeds Limited (AVANTIFEEDNS).
- Step 5: Utilize the results for making investment choices or for reporting purposes.
Why Choose This Calculator for Avanti Feeds Limited (AVANTIFEEDNS)?
- All-in-One Solution: Combines DCF, WACC, and financial ratio evaluations into a single platform.
- Flexible Input Options: Modify the highlighted cells to explore different financial scenarios.
- In-Depth Analysis: Automatically computes Avanti Feeds' intrinsic value and Net Present Value.
- Data Built-In: Access to historical and projected data for reliable baseline metrics.
- Expert Grade: Perfect for financial analysts, investors, and business advisors.
Who Can Benefit from Avanti Feeds Limited (AVANTIFEEDNS)?
- Investors: Make informed decisions with a top-tier valuation tool tailored for the aquaculture industry.
- Financial Analysts: Streamline your workflow with a customizable DCF model designed for Avanti Feeds Limited.
- Consultants: Effortlessly adapt presentations and reports for clients in the seafood and aquaculture sectors.
- Finance Enthusiasts: Enhance your grasp of valuation methods through practical, real-world applications in the industry.
- Educators and Students: Utilize this resource as a comprehensive learning aid in finance and aquaculture courses.
What the Template Contains
- Historical Data: Comprehensive records of Avanti Feeds Limited's (AVANTIFEEDNS) financial performance and baseline forecasts.
- DCF and Levered DCF Models: In-depth templates for assessing the intrinsic value of Avanti Feeds Limited (AVANTIFEEDNS).
- WACC Sheet: Pre-configured calculations for the Weighted Average Cost of Capital tailored for Avanti Feeds Limited (AVANTIFEEDNS).
- Editable Inputs: Customize essential parameters such as growth rates, EBITDA percentages, and CAPEX estimates.
- Quarterly and Annual Statements: Comprehensive reports detailing the financials of Avanti Feeds Limited (AVANTIFEEDNS).
- Interactive Dashboard: Dynamically visualize valuation results and projections for Avanti Feeds Limited (AVANTIFEEDNS).
Disclaimer
All information, articles, and product details provided on this website are for general informational and educational purposes only. We do not claim any ownership over, nor do we intend to infringe upon, any trademarks, copyrights, logos, brand names, or other intellectual property mentioned or depicted on this site. Such intellectual property remains the property of its respective owners, and any references here are made solely for identification or informational purposes, without implying any affiliation, endorsement, or partnership.
We make no representations or warranties, express or implied, regarding the accuracy, completeness, or suitability of any content or products presented. Nothing on this website should be construed as legal, tax, investment, financial, medical, or other professional advice. In addition, no part of this site—including articles or product references—constitutes a solicitation, recommendation, endorsement, advertisement, or offer to buy or sell any securities, franchises, or other financial instruments, particularly in jurisdictions where such activity would be unlawful.
All content is of a general nature and may not address the specific circumstances of any individual or entity. It is not a substitute for professional advice or services. Any actions you take based on the information provided here are strictly at your own risk. You accept full responsibility for any decisions or outcomes arising from your use of this website and agree to release us from any liability in connection with your use of, or reliance upon, the content or products found herein.