
|
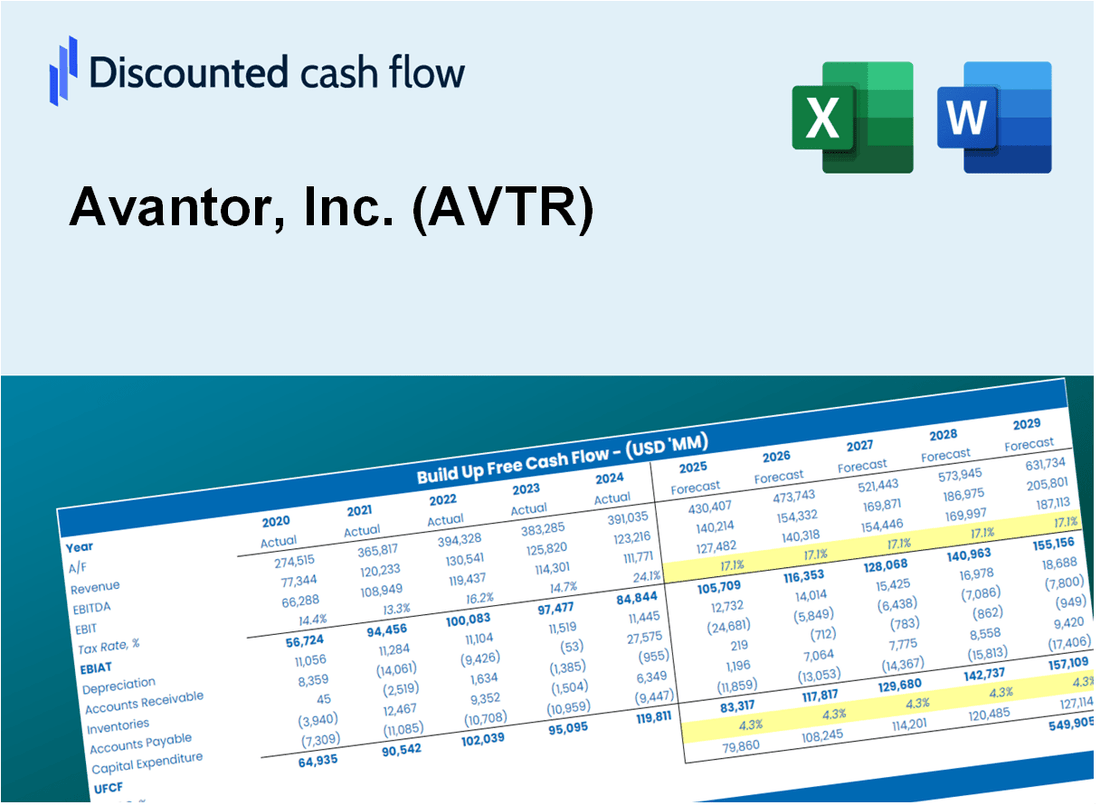
Avantor, Inc. (AVTR) Évaluation DCF |
Entièrement Modifiable: Adapté À Vos Besoins Dans Excel Ou Sheets
Conception Professionnelle: Modèles Fiables Et Conformes Aux Normes Du Secteur
Pré-Construits Pour Une Utilisation Rapide Et Efficace
Compatible MAC/PC, entièrement débloqué
Aucune Expertise N'Est Requise; Facile À Suivre
Avantor, Inc. (AVTR) Bundle
Vous cherchez à évaluer la valeur intrinsèque d'Avantor, Inc.? Notre calculatrice AVTR DCF intègre des données réelles avec des fonctionnalités de personnalisation étendues, vous permettant d'ajuster les prévisions et de faire des choix d'investissement plus éclairés.
What You Will Get
- Real AVTR Financial Data: Pre-filled with Avantor’s historical and projected data for precise analysis.
- Fully Editable Template: Modify key inputs like revenue growth, WACC, and EBITDA % with ease.
- Automatic Calculations: See Avantor’s intrinsic value update instantly based on your changes.
- Professional Valuation Tool: Designed for investors, analysts, and consultants seeking accurate DCF results.
- User-Friendly Design: Simple structure and clear instructions for all experience levels.
Key Features
- 🔍 Real-Life AVTR Financials: Pre-filled historical and projected data for Avantor, Inc.
- ✏️ Fully Customizable Inputs: Adjust all critical parameters (yellow cells) like WACC, growth %, and tax rates.
- 📊 Professional DCF Valuation: Built-in formulas calculate Avantor’s intrinsic value using the Discounted Cash Flow method.
- ⚡ Instant Results: Visualize Avantor’s valuation instantly after making changes.
- Scenario Analysis: Test and compare outcomes for various financial assumptions side-by-side.
How It Works
- Step 1: Download the Excel file.
- Step 2: Review pre-entered Avantor, Inc. (AVTR) data (historical and projected).
- Step 3: Adjust key assumptions (yellow cells) based on your analysis.
- Step 4: View automatic recalculations for Avantor, Inc. (AVTR)’s intrinsic value.
- Step 5: Use the outputs for investment decisions or reporting.
Why Choose This Calculator for Avantor, Inc. (AVTR)?
- User-Friendly Interface: Tailored for both novices and seasoned professionals.
- Customizable Inputs: Effortlessly adjust parameters to suit your analytical needs.
- Real-Time Feedback: Observe immediate changes in Avantor’s valuation with input adjustments.
- Preloaded Data: Comes with Avantor’s actual financial information for swift evaluations.
- Relied Upon by Experts: Utilized by investors and analysts for strategic decision-making.
Who Should Use This Product?
- Investors: Assess Avantor, Inc.'s (AVTR) valuation prior to making investment decisions.
- CFOs and Financial Analysts: Optimize valuation processes and evaluate financial forecasts.
- Startup Founders: Gain insights into how leading public companies like Avantor, Inc. are appraised.
- Consultants: Provide comprehensive valuation reports for your clients involving Avantor, Inc. (AVTR).
- Students and Educators: Utilize current data to practice and instruct on valuation methods.
What the Avantor Template Contains
- Comprehensive DCF Model: Editable template with detailed valuation calculations tailored for Avantor, Inc. (AVTR).
- Real-World Data: Avantor’s historical and projected financials preloaded for in-depth analysis.
- Customizable Parameters: Adjust WACC, growth rates, and tax assumptions to explore various scenarios.
- Financial Statements: Complete annual and quarterly breakdowns for enhanced insights into performance.
- Key Ratios: Integrated analysis for profitability, efficiency, and leverage specific to Avantor.
- Dashboard with Visual Outputs: Charts and tables designed for clear, actionable results on Avantor’s performance.
Disclaimer
All information, articles, and product details provided on this website are for general informational and educational purposes only. We do not claim any ownership over, nor do we intend to infringe upon, any trademarks, copyrights, logos, brand names, or other intellectual property mentioned or depicted on this site. Such intellectual property remains the property of its respective owners, and any references here are made solely for identification or informational purposes, without implying any affiliation, endorsement, or partnership.
We make no representations or warranties, express or implied, regarding the accuracy, completeness, or suitability of any content or products presented. Nothing on this website should be construed as legal, tax, investment, financial, medical, or other professional advice. In addition, no part of this site—including articles or product references—constitutes a solicitation, recommendation, endorsement, advertisement, or offer to buy or sell any securities, franchises, or other financial instruments, particularly in jurisdictions where such activity would be unlawful.
All content is of a general nature and may not address the specific circumstances of any individual or entity. It is not a substitute for professional advice or services. Any actions you take based on the information provided here are strictly at your own risk. You accept full responsibility for any decisions or outcomes arising from your use of this website and agree to release us from any liability in connection with your use of, or reliance upon, the content or products found herein.