
|
A2Z Smart Technologies Corp. (AZ) Évaluation DCF |
Entièrement Modifiable: Adapté À Vos Besoins Dans Excel Ou Sheets
Conception Professionnelle: Modèles Fiables Et Conformes Aux Normes Du Secteur
Pré-Construits Pour Une Utilisation Rapide Et Efficace
Compatible MAC/PC, entièrement débloqué
Aucune Expertise N'Est Requise; Facile À Suivre
A2Z Smart Technologies Corp. (AZ) Bundle
Simplifiez l'évaluation A2Z Smart Technologies Corp. (AZ) avec cette calculatrice DCF personnalisable! En utilisant les véritables A2Z Smart Technologies Corp. (AZ) Financials and Rajustement des intrants de prévision, vous pouvez explorer les scénarios et découvrir la juste valeur A2Z Smart Technologies Corp. (AZ) en quelques minutes.
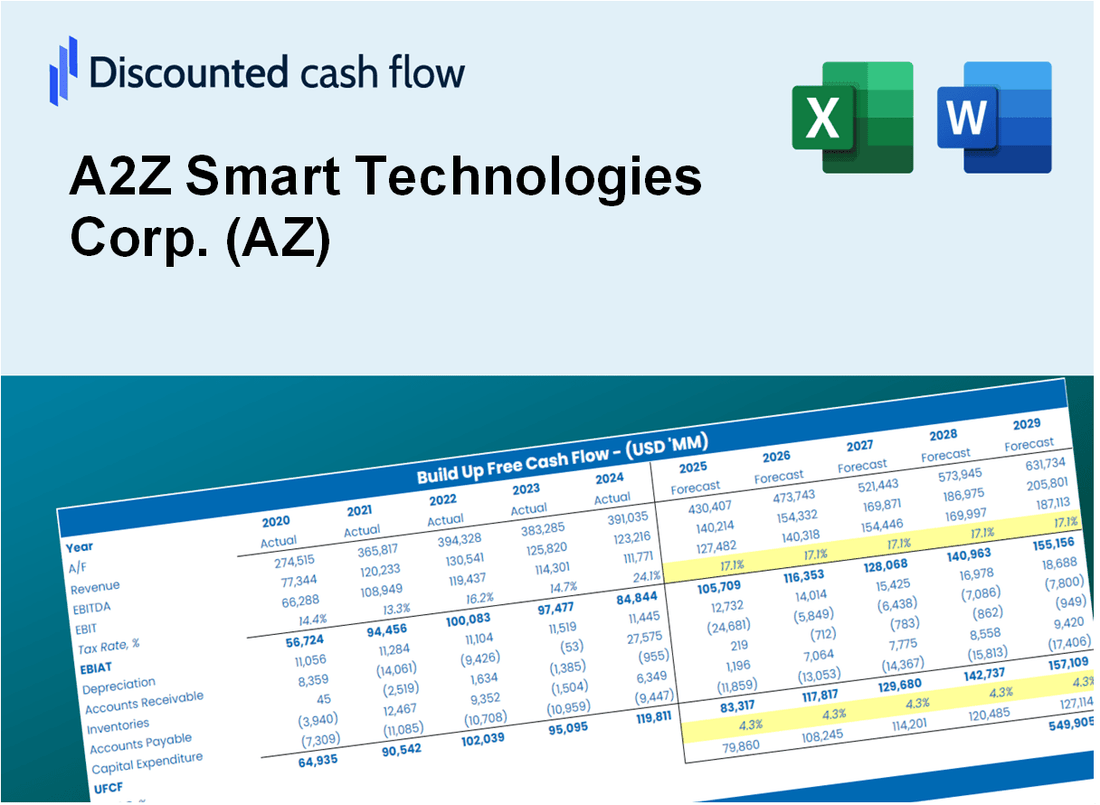
Discounted Cash Flow (DCF) - (USD MM)
| Year | AY1 2020 |
AY2 2021 |
AY3 2022 |
AY4 2023 |
AY5 2024 |
FY1 2025 |
FY2 2026 |
FY3 2027 |
FY4 2028 |
FY5 2029 |
|---|---|---|---|---|---|---|---|---|---|---|
| Revenue | 1.1 | 2.7 | 9.4 | 11.4 | 7.2 | 10.5 | 15.3 | 22.4 | 32.7 | 47.8 |
| Revenue Growth, % | 0 | 151.4 | 248.27 | 21.64 | -37 | 46.16 | 46.16 | 46.16 | 46.16 | 46.16 |
| EBITDA | -5.6 | -39.7 | -16.2 | -17.0 | -18.2 | -10.5 | -15.3 | -22.4 | -32.7 | -47.8 |
| EBITDA, % | -525.84 | -1479.93 | -172.92 | -149.17 | -253.39 | -100 | -100 | -100 | -100 | -100 |
| Depreciation | .2 | .3 | .8 | 1.0 | .9 | 1.3 | 1.9 | 2.8 | 4.1 | 5.9 |
| Depreciation, % | 21 | 11.85 | 8.07 | 9.03 | 12.03 | 12.4 | 12.4 | 12.4 | 12.4 | 12.4 |
| EBIT | -5.8 | -40.1 | -16.9 | -18.0 | -19.0 | -10.5 | -15.3 | -22.4 | -32.7 | -47.8 |
| EBIT, % | -546.84 | -1491.78 | -181 | -158.2 | -265.42 | -100 | -100 | -100 | -100 | -100 |
| Total Cash | 5.4 | 8.5 | 2.6 | 2.3 | 13.7 | 7.3 | 10.7 | 15.6 | 22.8 | 33.3 |
| Total Cash, percent | .0 | .0 | .0 | .0 | .0 | .0 | .0 | .0 | .0 | .0 |
| Account Receivables | .3 | 1.2 | 2.3 | 1.8 | 2.4 | 3.0 | 4.4 | 6.4 | 9.4 | 13.8 |
| Account Receivables, % | 24.16 | 46.22 | 24.32 | 15.95 | 33.24 | 28.78 | 28.78 | 28.78 | 28.78 | 28.78 |
| Inventories | .0 | 1.1 | .4 | .3 | .8 | 1.3 | 1.9 | 2.8 | 4.0 | 5.9 |
| Inventories, % | 1.78 | 42.72 | 4.01 | 2.2 | 11.11 | 12.36 | 12.36 | 12.36 | 12.36 | 12.36 |
| Accounts Payable | .5 | 1.0 | 2.2 | 1.7 | 1.8 | 3.2 | 4.7 | 6.8 | 10.0 | 14.5 |
| Accounts Payable, % | 50.66 | 36.83 | 23.78 | 15.31 | 25.59 | 30.44 | 30.44 | 30.44 | 30.44 | 30.44 |
| Capital Expenditure | -.2 | -.4 | -.7 | -.2 | -.1 | -1.0 | -1.5 | -2.2 | -3.2 | -4.6 |
| Capital Expenditure, % | -21.82 | -15.34 | -7.77 | -1.53 | -1.95 | -9.68 | -9.68 | -9.68 | -9.68 | -9.68 |
| Tax Rate, % | 11.77 | 11.77 | 11.77 | 11.77 | 11.77 | 11.77 | 11.77 | 11.77 | 11.77 | 11.77 |
| EBITAT | -5.9 | -40.2 | -17.5 | -16.0 | -16.8 | -10.0 | -14.6 | -21.4 | -31.2 | -45.6 |
| Depreciation | ||||||||||
| Changes in Account Receivables | ||||||||||
| Changes in Inventories | ||||||||||
| Changes in Accounts Payable | ||||||||||
| Capital Expenditure | ||||||||||
| UFCF | -5.6 | -42.0 | -16.5 | -15.0 | -17.1 | -9.5 | -14.7 | -21.5 | -31.4 | -45.9 |
| WACC, % | 11.5 | 11.5 | 11.5 | 11.48 | 11.48 | 11.49 | 11.49 | 11.49 | 11.49 | 11.49 |
| PV UFCF | ||||||||||
| SUM PV UFCF | -82.9 | |||||||||
| Long Term Growth Rate, % | 2.00 | |||||||||
| Free cash flow (T + 1) | -47 | |||||||||
| Terminal Value | -494 | |||||||||
| Present Terminal Value | -287 | |||||||||
| Enterprise Value | -369 | |||||||||
| Net Debt | -12 | |||||||||
| Equity Value | -357 | |||||||||
| Diluted Shares Outstanding, MM | 21 | |||||||||
| Equity Value Per Share | -16.72 |
What You Will Get
- Comprehensive AZ Financials: Access to historical and projected data for precise valuation.
- Customizable Parameters: Adjust WACC, tax rates, revenue growth, and capital expenditures as needed.
- Real-Time Calculations: Intrinsic value and NPV are updated automatically.
- Scenario Analysis: Evaluate multiple scenarios to assess A2Z Smart Technologies' future potential.
- User-Friendly Interface: Designed for industry experts while remaining approachable for newcomers.
Key Features
- Comprehensive Data: A2Z Smart Technologies Corp. (AZ) provides access to detailed historical financial reports and predictive analytics.
- Customizable Parameters: Adjust key metrics such as WACC, tax rates, revenue growth, and EBITDA margins to fit your analysis.
- Real-Time Insights: Instantly view the recalculated intrinsic value of A2Z Smart Technologies Corp. (AZ) as inputs change.
- Intuitive Visualizations: Interactive dashboard charts showcase valuation outcomes and essential performance indicators.
- Designed for Precision: A robust tool tailored for analysts, investors, and finance professionals seeking accuracy.
How It Works
- Step 1: Download the Excel file.
- Step 2: Review pre-entered A2Z Smart Technologies data (historical and projected).
- Step 3: Adjust key assumptions (yellow cells) based on your analysis.
- Step 4: View automatic recalculations for A2Z Smart Technologies' intrinsic value.
- Step 5: Use the outputs for investment decisions or reporting.
Why Choose A2Z Smart Technologies Corp. (AZ) Calculator?
- All-in-One Solution: Features DCF, WACC, and financial ratio analyses seamlessly integrated.
- Flexible Inputs: Modify the highlighted cells to explore different financial scenarios.
- In-Depth Analysis: Automatically computes A2Z's intrinsic value and Net Present Value.
- Data-Rich: Comes with historical and projected data for precise analysis.
- Expert Standard: Perfect for financial analysts, investors, and business advisors.
Who Should Use A2Z Smart Technologies Corp. (AZ)?
- Investors: Evaluate A2Z Smart Technologies Corp.'s (AZ) performance before making investment decisions.
- CFOs and Financial Analysts: Optimize valuation methodologies and assess future projections for A2Z Smart Technologies Corp. (AZ).
- Startup Founders: Gain insights into the valuation practices of innovative companies like A2Z Smart Technologies Corp. (AZ).
- Consultants: Provide detailed valuation analyses and reports for clients considering A2Z Smart Technologies Corp. (AZ).
- Students and Educators: Utilize real-time data from A2Z Smart Technologies Corp. (AZ) to learn and teach valuation strategies.
What the Template Contains
- Operating and Balance Sheet Data: Pre-filled A2Z Smart Technologies Corp. (AZ) historical data and forecasts, including revenue, EBITDA, EBIT, and capital expenditures.
- WACC Calculation: A dedicated sheet for Weighted Average Cost of Capital (WACC), featuring parameters like Beta, risk-free rate, and share price.
- DCF Valuation (Unlevered and Levered): Editable Discounted Cash Flow models demonstrating intrinsic value with comprehensive calculations.
- Financial Statements: Pre-loaded financial statements (annual and quarterly) to facilitate analysis.
- Key Ratios: Includes profitability, leverage, and efficiency ratios for A2Z Smart Technologies Corp. (AZ).
- Dashboard and Charts: Visual summary of valuation outputs and assumptions for easy result analysis.
Disclaimer
All information, articles, and product details provided on this website are for general informational and educational purposes only. We do not claim any ownership over, nor do we intend to infringe upon, any trademarks, copyrights, logos, brand names, or other intellectual property mentioned or depicted on this site. Such intellectual property remains the property of its respective owners, and any references here are made solely for identification or informational purposes, without implying any affiliation, endorsement, or partnership.
We make no representations or warranties, express or implied, regarding the accuracy, completeness, or suitability of any content or products presented. Nothing on this website should be construed as legal, tax, investment, financial, medical, or other professional advice. In addition, no part of this site—including articles or product references—constitutes a solicitation, recommendation, endorsement, advertisement, or offer to buy or sell any securities, franchises, or other financial instruments, particularly in jurisdictions where such activity would be unlawful.
All content is of a general nature and may not address the specific circumstances of any individual or entity. It is not a substitute for professional advice or services. Any actions you take based on the information provided here are strictly at your own risk. You accept full responsibility for any decisions or outcomes arising from your use of this website and agree to release us from any liability in connection with your use of, or reliance upon, the content or products found herein.