
|
Bajaj Holdings & Investment Limited (Bajajhldng.ns) Valeure DCF |
Entièrement Modifiable: Adapté À Vos Besoins Dans Excel Ou Sheets
Conception Professionnelle: Modèles Fiables Et Conformes Aux Normes Du Secteur
Pré-Construits Pour Une Utilisation Rapide Et Efficace
Compatible MAC/PC, entièrement débloqué
Aucune Expertise N'Est Requise; Facile À Suivre
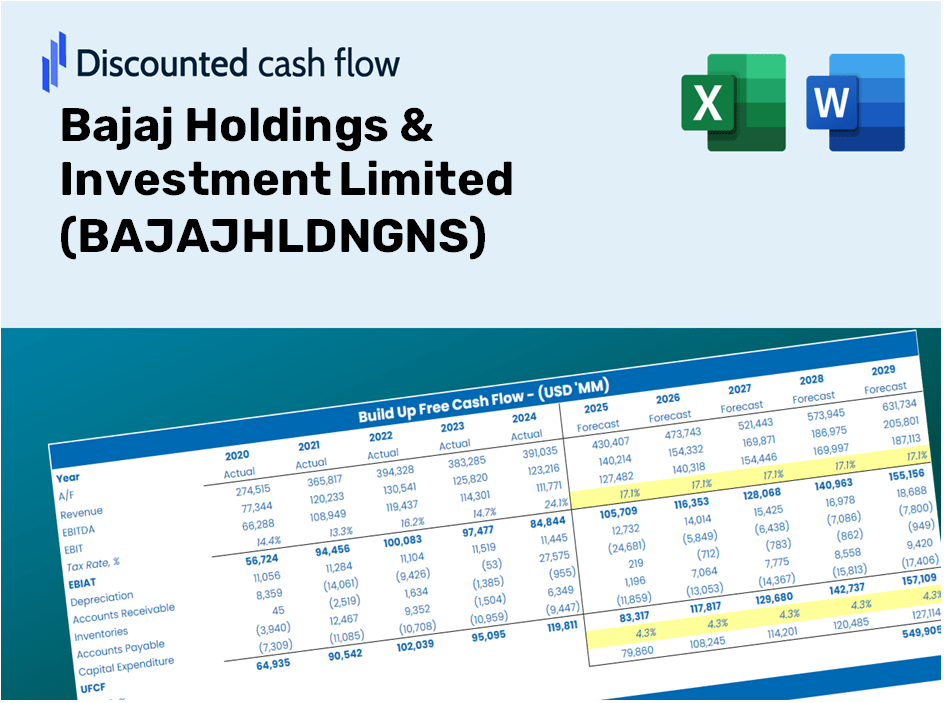
Bajaj Holdings & Investment Limited (BAJAJHLDNG.NS) Bundle
Explorez l'avenir financier de Bajaj Holdings & Investment Limited avec notre calculatrice DCF conviviale! Entrez vos hypothèses pour la croissance, les marges et les coûts pour calculer la valeur intrinsèque de Bajaj Holdings & Investment Limited (BajajhldNGNS) et affinez votre stratégie d'investissement.
Discounted Cash Flow (DCF) - (USD MM)
| Year | AY1 2021 |
AY2 2022 |
AY3 2023 |
AY4 2024 |
AY5 2025 |
FY1 2026 |
FY2 2027 |
FY3 2028 |
FY4 2029 |
FY5 2030 |
|---|---|---|---|---|---|---|---|---|---|---|
| Revenue | 4,579.0 | 4,734.6 | 5,144.0 | 17,133.8 | 7,291.9 | 8,287.3 | 9,418.6 | 10,704.3 | 12,165.6 | 13,826.3 |
| Revenue Growth, % | 0 | 3.4 | 8.65 | 233.08 | -57.44 | 13.65 | 13.65 | 13.65 | 13.65 | 13.65 |
| EBITDA | 3,651.6 | 3,780.1 | 3,942.8 | 15,843.2 | 6,009.8 | 6,814.2 | 7,744.4 | 8,801.5 | 10,003.0 | 11,368.5 |
| EBITDA, % | 79.75 | 79.84 | 76.65 | 92.47 | 82.42 | 82.22 | 82.22 | 82.22 | 82.22 | 82.22 |
| Depreciation | 335.9 | 336.9 | 338.4 | 338.4 | 337.8 | 458.1 | 520.6 | 591.7 | 672.5 | 764.2 |
| Depreciation, % | 7.34 | 7.12 | 6.58 | 1.98 | 4.63 | 5.53 | 5.53 | 5.53 | 5.53 | 5.53 |
| EBIT | 3,315.7 | 3,443.2 | 3,604.4 | 15,504.8 | 5,672.0 | 6,356.1 | 7,223.7 | 8,209.8 | 9,330.6 | 10,604.3 |
| EBIT, % | 72.41 | 72.72 | 70.07 | 90.49 | 77.78 | 76.7 | 76.7 | 76.7 | 76.7 | 76.7 |
| Total Cash | 832.6 | 219.3 | 258.3 | 397.8 | 998.9 | 726.9 | 826.1 | 938.9 | 1,067.1 | 1,212.8 |
| Total Cash, percent | .0 | .0 | .0 | .0 | .0 | .0 | .0 | .0 | .0 | .0 |
| Account Receivables | 1,039.8 | 1,051.1 | 975.1 | 967.6 | 11,139.0 | 2,809.6 | 3,193.1 | 3,629.0 | 4,124.4 | 4,687.4 |
| Account Receivables, % | 22.71 | 22.2 | 18.96 | 5.65 | 152.76 | 33.9 | 33.9 | 33.9 | 33.9 | 33.9 |
| Inventories | 36.0 | 64.6 | 38.0 | .0 | .0 | 47.9 | 54.4 | 61.9 | 70.3 | 79.9 |
| Inventories, % | 0.7862 | 1.36 | 0.73872 | 0 | 0 | 0.57787 | 0.57787 | 0.57787 | 0.57787 | 0.57787 |
| Accounts Payable | 32.4 | 43.4 | 17.8 | 27.8 | 50.5 | 46.8 | 53.2 | 60.5 | 68.7 | 78.1 |
| Accounts Payable, % | 0.70758 | 0.91666 | 0.34603 | 0.16225 | 0.69255 | 0.56501 | 0.56501 | 0.56501 | 0.56501 | 0.56501 |
| Capital Expenditure | -11.3 | -13.3 | -20.0 | -3.1 | -7.8 | -17.3 | -19.6 | -22.3 | -25.3 | -28.8 |
| Capital Expenditure, % | -0.24678 | -0.28091 | -0.3888 | -0.01809289 | -0.10697 | -0.20831 | -0.20831 | -0.20831 | -0.20831 | -0.20831 |
| Tax Rate, % | 3.37 | 3.37 | 3.37 | 3.37 | 3.37 | 3.37 | 3.37 | 3.37 | 3.37 | 3.37 |
| EBITAT | 3,213.6 | 3,304.5 | 3,488.6 | 15,038.6 | 5,481.1 | 6,143.9 | 6,982.6 | 7,935.8 | 9,019.1 | 10,250.3 |
| Depreciation | ||||||||||
| Changes in Account Receivables | ||||||||||
| Changes in Inventories | ||||||||||
| Changes in Accounts Payable | ||||||||||
| Capital Expenditure | ||||||||||
| UFCF | 2,494.8 | 3,599.2 | 3,884.0 | 15,429.4 | -4,337.6 | 14,862.5 | 7,099.9 | 8,069.1 | 9,170.6 | 10,422.5 |
| WACC, % | 4.68 | 4.68 | 4.68 | 4.68 | 4.68 | 4.68 | 4.68 | 4.68 | 4.68 | 4.68 |
| PV UFCF | ||||||||||
| SUM PV UFCF | 43,636.5 | |||||||||
| Long Term Growth Rate, % | 2.00 | |||||||||
| Free cash flow (T + 1) | 10,631 | |||||||||
| Terminal Value | 396,088 | |||||||||
| Present Terminal Value | 315,058 | |||||||||
| Enterprise Value | 358,694 | |||||||||
| Net Debt | -689 | |||||||||
| Equity Value | 359,383 | |||||||||
| Diluted Shares Outstanding, MM | 111 | |||||||||
| Equity Value Per Share | 3,229.25 |
Benefits You Will Receive
- Customizable Excel Template: A fully adjustable Excel-based DCF Calculator featuring pre-loaded financial data for BAJAJHLDNGNS.
- Accurate Historical Data: Access to past performance metrics and future projections (highlighted in the yellow cells).
- Flexible Forecasting: Modify key assumptions such as revenue growth, EBITDA percentages, and WACC at your discretion.
- Instant Calculations: Quickly observe how your inputs affect the valuation of Bajaj Holdings.
- Professional-grade Tool: Designed for investors, CFOs, consultants, and financial analysts alike.
- Intuitive Interface: Organized for simplicity and effectiveness, complete with step-by-step guidance.
Key Features
- Customizable Financial Inputs: Adjust essential factors such as revenue growth, EBITDA percentage, and capital expenditures.
- Instant DCF Valuation: Automatically computes intrinsic value, NPV, and other financial metrics with no delay.
- High Accuracy Standards: Leverages Bajaj Holdings & Investment Limited’s (BAJAJHLDNGNS) actual financial data for realistic valuation results.
- Simplified Scenario Analysis: Easily experiment with varying assumptions and effortlessly compare different outcomes.
- Efficiency Booster: Removes the necessity of constructing intricate valuation models from the ground up.
How It Functions
- 1. Access the Template: Download and open the Excel file containing Bajaj Holdings & Investment Limited’s preloaded data.
- 2. Modify Assumptions: Adjust key inputs such as growth rates, WACC, and capital expenditures.
- 3. View Results in Real-Time: The DCF model automatically calculates intrinsic value and NPV.
- 4. Explore Scenarios: Analyze various forecasts to evaluate different valuation outcomes.
- 5. Present with Assurance: Share professional valuation insights to back your decisions.
Why Opt for This Calculator?
- Designed for Experts: A sophisticated tool utilized by analysts, CFOs, and consultants in the industry.
- Accurate Financial Data: Bajaj Holdings & Investment Limited’s historical and projected financial information is preloaded for precision.
- Scenario Analysis: Effortlessly simulate various forecasts and assumptions.
- Comprehensive Outputs: Automatically computes intrinsic value, NPV, and essential metrics.
- User-Friendly: Detailed step-by-step instructions to facilitate the process.
Who Can Benefit from Bajaj Holdings & Investment Limited (BAJAJHLDNGNS)?
- Finance Students: Master valuation methods and practice with real-world data.
- Academics: Integrate industry-standard models into your teaching or research projects.
- Investors: Challenge your assumptions and evaluate valuation results for Bajaj Holdings.
- Analysts: Optimize your analysis process with a ready-to-use, customizable DCF model.
- Small Business Owners: Discover how large public entities like Bajaj Holdings are assessed in the market.
Contents of the Template
- In-depth DCF Model: A fully editable template featuring comprehensive valuation calculations.
- Actual Financial Data: Preloaded historical and projected financials for Bajaj Holdings & Investment Limited (BAJAJHLDNGNS) to facilitate analysis.
- Adjustable Variables: Modify WACC, growth rates, and tax assumptions to explore different scenarios.
- Detailed Financial Statements: Complete annual and quarterly breakdowns for enhanced insights.
- Essential Ratios: Integrated analysis for evaluating profitability, efficiency, and financial leverage.
- Visual Dashboard: Charts and tables that present clear, actionable results.
Disclaimer
All information, articles, and product details provided on this website are for general informational and educational purposes only. We do not claim any ownership over, nor do we intend to infringe upon, any trademarks, copyrights, logos, brand names, or other intellectual property mentioned or depicted on this site. Such intellectual property remains the property of its respective owners, and any references here are made solely for identification or informational purposes, without implying any affiliation, endorsement, or partnership.
We make no representations or warranties, express or implied, regarding the accuracy, completeness, or suitability of any content or products presented. Nothing on this website should be construed as legal, tax, investment, financial, medical, or other professional advice. In addition, no part of this site—including articles or product references—constitutes a solicitation, recommendation, endorsement, advertisement, or offer to buy or sell any securities, franchises, or other financial instruments, particularly in jurisdictions where such activity would be unlawful.
All content is of a general nature and may not address the specific circumstances of any individual or entity. It is not a substitute for professional advice or services. Any actions you take based on the information provided here are strictly at your own risk. You accept full responsibility for any decisions or outcomes arising from your use of this website and agree to release us from any liability in connection with your use of, or reliance upon, the content or products found herein.