
|
Bally's Corporation (BALY) Valation DCF |
Entièrement Modifiable: Adapté À Vos Besoins Dans Excel Ou Sheets
Conception Professionnelle: Modèles Fiables Et Conformes Aux Normes Du Secteur
Pré-Construits Pour Une Utilisation Rapide Et Efficace
Compatible MAC/PC, entièrement débloqué
Aucune Expertise N'Est Requise; Facile À Suivre
Bally's Corporation (BALY) Bundle
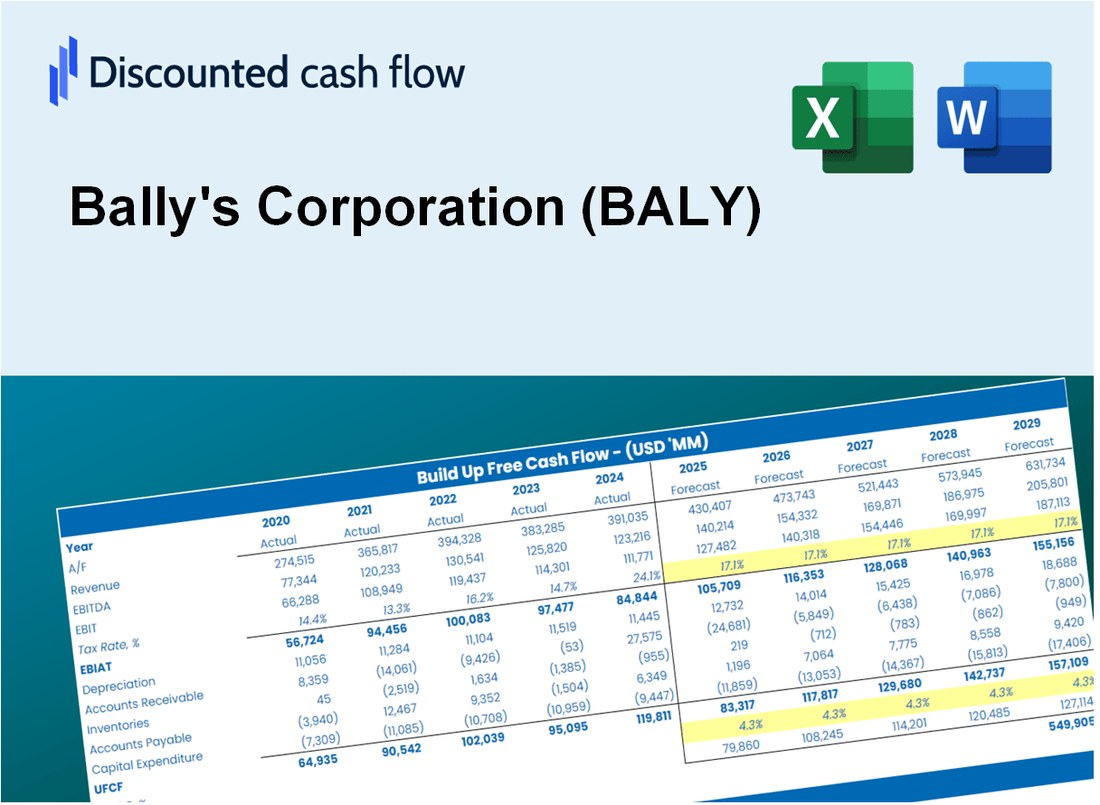
Conçu pour la précision, la calculatrice DCF de notre Bally's Corporation (BALY) vous permet d'évaluer l'évaluation de la société de Bally en utilisant des données financières réelles, tout en offrant une flexibilité complète pour modifier tous les paramètres essentiels pour des projections améliorées.
Discounted Cash Flow (DCF) - (USD MM)
| Year | AY1 2020 |
AY2 2021 |
AY3 2022 |
AY4 2023 |
AY5 2024 |
FY1 2025 |
FY2 2026 |
FY3 2027 |
FY4 2028 |
FY5 2029 |
|---|---|---|---|---|---|---|---|---|---|---|
| Revenue | 372.8 | 1,322.4 | 2,255.7 | 2,449.1 | 2,450.5 | 3,548.3 | 5,137.9 | 7,439.8 | 10,772.8 | 15,599.0 |
| Revenue Growth, % | 0 | 254.74 | 70.57 | 8.57 | 0.05736865 | 44.8 | 44.8 | 44.8 | 44.8 | 44.8 |
| EBITDA | 25.7 | 143.6 | 54.9 | 448.3 | 137.4 | 312.9 | 453.1 | 656.1 | 950.0 | 1,375.6 |
| EBITDA, % | 6.89 | 10.86 | 2.43 | 18.31 | 5.61 | 8.82 | 8.82 | 8.82 | 8.82 | 8.82 |
| Depreciation | 37.8 | 144.8 | 300.6 | 350.4 | 379.5 | 455.7 | 659.9 | 955.6 | 1,383.7 | 2,003.5 |
| Depreciation, % | 10.15 | 10.95 | 13.32 | 14.31 | 15.49 | 12.84 | 12.84 | 12.84 | 12.84 | 12.84 |
| EBIT | -12.2 | -1.2 | -245.7 | 97.9 | -242.2 | -142.8 | -206.8 | -299.5 | -433.7 | -628.0 |
| EBIT, % | -3.27 | -0.08696027 | -10.89 | 4 | -9.88 | -4.03 | -4.03 | -4.03 | -4.03 | -4.03 |
| Total Cash | 128.1 | 206.2 | 212.5 | 163.2 | 171.2 | 518.3 | 750.5 | 1,086.7 | 1,573.5 | 2,278.4 |
| Total Cash, percent | .0 | .0 | .0 | .0 | .0 | .0 | .0 | .0 | .0 | .0 |
| Account Receivables | 8.7 | 210.7 | 166.6 | 165.2 | 118.2 | 264.1 | 382.5 | 553.8 | 801.9 | 1,161.2 |
| Account Receivables, % | 2.34 | 15.93 | 7.39 | 6.74 | 4.82 | 7.44 | 7.44 | 7.44 | 7.44 | 7.44 |
| Inventories | 9.3 | 11.5 | 14.2 | 14.6 | 19.3 | 38.2 | 55.3 | 80.0 | 115.9 | 167.8 |
| Inventories, % | 2.49 | 0.86877 | 0.62912 | 0.59733 | 0.7883 | 1.08 | 1.08 | 1.08 | 1.08 | 1.08 |
| Accounts Payable | 15.9 | 87.5 | 70.1 | 69.2 | 85.8 | 144.1 | 208.7 | 302.2 | 437.5 | 633.5 |
| Accounts Payable, % | 4.26 | 6.62 | 3.11 | 2.82 | 3.5 | 4.06 | 4.06 | 4.06 | 4.06 | 4.06 |
| Capital Expenditure | -15.3 | -162.7 | -412.3 | -502.2 | -199.8 | -449.5 | -650.9 | -942.5 | -1,364.7 | -1,976.1 |
| Capital Expenditure, % | -4.1 | -12.31 | -18.28 | -20.5 | -8.15 | -12.67 | -12.67 | -12.67 | -12.67 | -12.67 |
| Tax Rate, % | -2.76 | -2.76 | -2.76 | -2.76 | -2.76 | -2.76 | -2.76 | -2.76 | -2.76 | -2.76 |
| EBITAT | -.9 | -1.1 | -230.1 | 98.9 | -248.8 | -113.5 | -164.4 | -238.0 | -344.6 | -499.0 |
| Depreciation | ||||||||||
| Changes in Account Receivables | ||||||||||
| Changes in Inventories | ||||||||||
| Changes in Accounts Payable | ||||||||||
| Capital Expenditure | ||||||||||
| UFCF | 19.5 | -151.6 | -317.9 | -52.8 | -10.2 | -213.7 | -226.2 | -327.5 | -474.2 | -686.7 |
| WACC, % | 1.93 | 6.72 | 6.57 | 6.92 | 6.92 | 5.81 | 5.81 | 5.81 | 5.81 | 5.81 |
| PV UFCF | ||||||||||
| SUM PV UFCF | -1,576.5 | |||||||||
| Long Term Growth Rate, % | 2.00 | |||||||||
| Free cash flow (T + 1) | -700 | |||||||||
| Terminal Value | -18,375 | |||||||||
| Present Terminal Value | -13,854 | |||||||||
| Enterprise Value | -15,430 | |||||||||
| Net Debt | 4,768 | |||||||||
| Equity Value | -20,198 | |||||||||
| Diluted Shares Outstanding, MM | 48 | |||||||||
| Equity Value Per Share | -416.72 |
What You Will Receive
- Customizable Excel Template: A fully adjustable Excel-based DCF Calculator featuring pre-filled financial data for Bally's Corporation (BALY).
- Accurate Financial Data: Access to historical information and forward-looking projections (highlighted in the yellow cells).
- Flexible Forecasting: Modify forecast assumptions such as revenue growth, EBITDA margin, and WACC.
- Instant Calculations: Quickly observe how your inputs affect Bally's valuation.
- Professional Resource: Designed for investors, CFOs, consultants, and financial analysts.
- Intuitive Layout: Organized for clarity and ease of navigation, complete with step-by-step guidance.
Key Features
- 🔍 Real-Life BALY Financials: Pre-filled historical and projected data for Bally's Corporation.
- ✏️ Fully Customizable Inputs: Adjust all critical parameters (yellow cells) like WACC, growth %, and tax rates.
- 📊 Professional DCF Valuation: Built-in formulas calculate Bally's intrinsic value using the Discounted Cash Flow method.
- ⚡ Instant Results: Visualize Bally's valuation instantly after making changes.
- Scenario Analysis: Test and compare outcomes for various financial assumptions side-by-side.
How It Works
- Download: Obtain the pre-configured Excel file containing Bally's Corporation’s (BALY) financial data.
- Customize: Modify forecasts, such as revenue growth, EBITDA %, and WACC as needed.
- Update Automatically: The intrinsic value and NPV calculations refresh in real-time.
- Test Scenarios: Generate various projections and instantly compare the results.
- Make Decisions: Utilize the valuation outcomes to inform your investment strategy.
Why Choose This Calculator?
- Accuracy: Utilizes real Bally's Corporation (BALY) financials to ensure precise data.
- Flexibility: Tailored for users to experiment and adjust inputs as needed.
- Time-Saving: Eliminate the complexity of constructing a DCF model from the ground up.
- Professional-Grade: Crafted with the precision and usability expected by CFOs.
- User-Friendly: Intuitive design makes it accessible for users without extensive financial modeling skills.
Who Should Use This Product?
- Investors: Accurately assess Bally's Corporation's (BALY) fair value prior to making investment choices.
- CFOs: Utilize a top-tier DCF model for comprehensive financial reporting and analysis.
- Consultants: Effortlessly modify the template for valuation reports tailored to clients.
- Entrepreneurs: Acquire insights into financial modeling practices employed by industry leaders.
- Educators: Implement it as a teaching resource to illustrate valuation techniques.
What the Template Contains
- Pre-Filled Data: Includes Bally's Corporation's historical financials and forecasts.
- Discounted Cash Flow Model: Editable DCF valuation model with automatic calculations.
- Weighted Average Cost of Capital (WACC): A dedicated sheet for calculating WACC based on custom inputs.
- Key Financial Ratios: Analyze Bally's profitability, efficiency, and leverage.
- Customizable Inputs: Edit revenue growth, margins, and tax rates with ease.
- Clear Dashboard: Charts and tables summarizing key valuation results.
Disclaimer
All information, articles, and product details provided on this website are for general informational and educational purposes only. We do not claim any ownership over, nor do we intend to infringe upon, any trademarks, copyrights, logos, brand names, or other intellectual property mentioned or depicted on this site. Such intellectual property remains the property of its respective owners, and any references here are made solely for identification or informational purposes, without implying any affiliation, endorsement, or partnership.
We make no representations or warranties, express or implied, regarding the accuracy, completeness, or suitability of any content or products presented. Nothing on this website should be construed as legal, tax, investment, financial, medical, or other professional advice. In addition, no part of this site—including articles or product references—constitutes a solicitation, recommendation, endorsement, advertisement, or offer to buy or sell any securities, franchises, or other financial instruments, particularly in jurisdictions where such activity would be unlawful.
All content is of a general nature and may not address the specific circumstances of any individual or entity. It is not a substitute for professional advice or services. Any actions you take based on the information provided here are strictly at your own risk. You accept full responsibility for any decisions or outcomes arising from your use of this website and agree to release us from any liability in connection with your use of, or reliance upon, the content or products found herein.