
|
Brookfield Asset Management Inc. (BAM) Évaluation DCF |
Entièrement Modifiable: Adapté À Vos Besoins Dans Excel Ou Sheets
Conception Professionnelle: Modèles Fiables Et Conformes Aux Normes Du Secteur
Pré-Construits Pour Une Utilisation Rapide Et Efficace
Compatible MAC/PC, entièrement débloqué
Aucune Expertise N'Est Requise; Facile À Suivre
Brookfield Asset Management Inc. (BAM) Bundle
En tant qu'investisseur ou analyste, la calculatrice DCF de Brookfield Asset Management Inc. (BAM) est votre ressource incontournable pour une évaluation précise. Avec de vraies données de Brookfield Asset Management Inc. déjà intégrées, vous pouvez facilement ajuster les prévisions et observer immédiatement les effets.
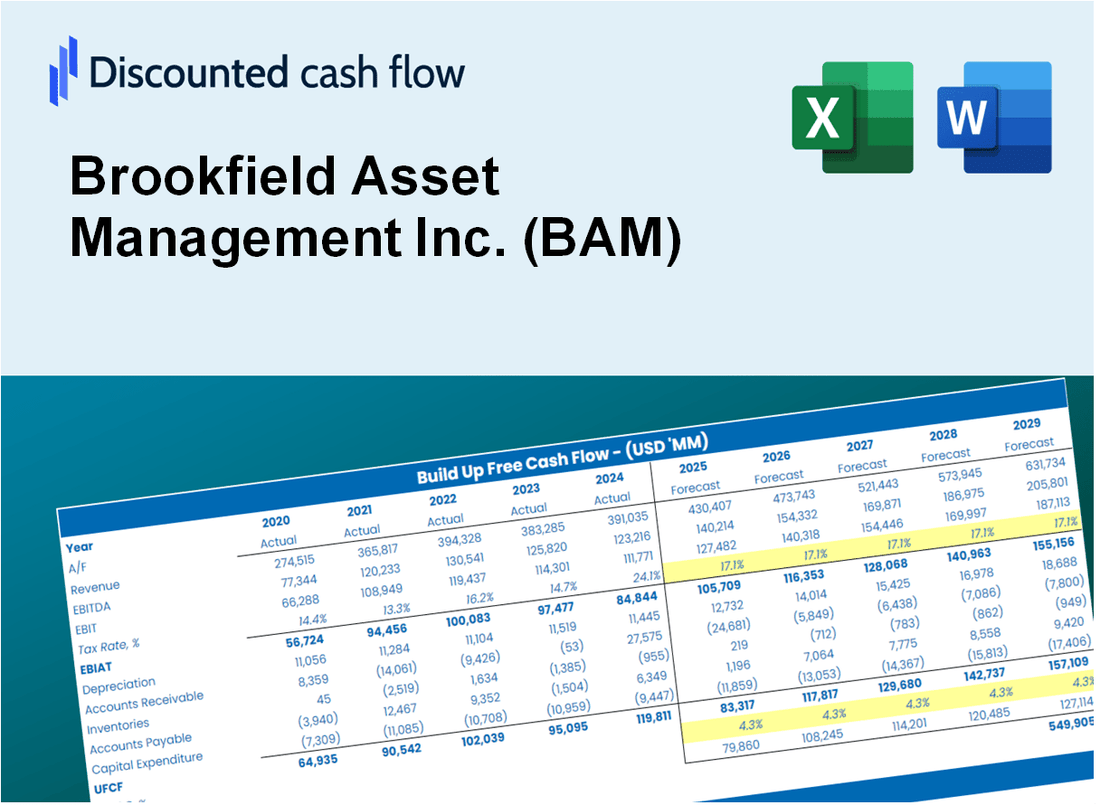
Discounted Cash Flow (DCF) - (USD MM)
| Year | AY1 2020 |
AY2 2021 |
AY3 2022 |
AY4 2023 |
AY5 2024 |
FY1 2025 |
FY2 2026 |
FY3 2027 |
FY4 2028 |
FY5 2029 |
|---|---|---|---|---|---|---|---|---|---|---|
| Revenue | 2,154.0 | 3,087.0 | 3,627.0 | 4,062.0 | 3,980.0 | 4,684.3 | 5,513.2 | 6,488.8 | 7,637.0 | 8,988.4 |
| Revenue Growth, % | 0 | 43.31 | 17.49 | 11.99 | -2.02 | 17.7 | 17.7 | 17.7 | 17.7 | 17.7 |
| EBITDA | 1,371.0 | 2,078.0 | 2,623.0 | 2,630.0 | 2,429.0 | 3,082.8 | 3,628.3 | 4,270.4 | 5,026.0 | 5,915.4 |
| EBITDA, % | 63.65 | 67.31 | 72.32 | 64.75 | 61.03 | 65.81 | 65.81 | 65.81 | 65.81 | 65.81 |
| Depreciation | 7.0 | 11.0 | 13.0 | 14.0 | 14.0 | 16.3 | 19.1 | 22.5 | 26.5 | 31.2 |
| Depreciation, % | 0.32498 | 0.35633 | 0.35842 | 0.34466 | 0.35176 | 0.34723 | 0.34723 | 0.34723 | 0.34723 | 0.34723 |
| EBIT | 1,364.0 | 2,067.0 | 2,610.0 | 2,616.0 | 2,415.0 | 3,066.5 | 3,609.2 | 4,247.9 | 4,999.5 | 5,884.2 |
| EBIT, % | 63.32 | 66.96 | 71.96 | 64.4 | 60.68 | 65.46 | 65.46 | 65.46 | 65.46 | 65.46 |
| Total Cash | 2,101.0 | 2,494.0 | 1.0 | 9.0 | 12.0 | 1,675.9 | 1,972.4 | 2,321.4 | 2,732.2 | 3,215.7 |
| Total Cash, percent | .0 | .0 | .0 | .0 | .0 | .0 | .0 | .0 | .0 | .0 |
| Account Receivables | 54.0 | 7,592.0 | 782.0 | 886.0 | 968.0 | 1,594.5 | 1,876.7 | 2,208.8 | 2,599.7 | 3,059.7 |
| Account Receivables, % | 2.51 | 245.93 | 21.56 | 21.81 | 24.32 | 34.04 | 34.04 | 34.04 | 34.04 | 34.04 |
| Inventories | .0 | .0 | .0 | .0 | .0 | .0 | .0 | .0 | .0 | .0 |
| Inventories, % | 0 | 0 | 0 | 0 | 0 | 0 | 0 | 0 | 0 | 0 |
| Accounts Payable | 611.0 | 561.0 | 781.0 | 859.0 | 879.0 | 1,042.8 | 1,227.3 | 1,444.5 | 1,700.1 | 2,000.9 |
| Accounts Payable, % | 28.37 | 18.17 | 21.53 | 21.15 | 22.09 | 22.26 | 22.26 | 22.26 | 22.26 | 22.26 |
| Capital Expenditure | -20.0 | -35.0 | -13.0 | -17.0 | -8.0 | -28.5 | -33.5 | -39.5 | -46.4 | -54.7 |
| Capital Expenditure, % | -0.92851 | -1.13 | -0.35842 | -0.41851 | -0.20101 | -0.60805 | -0.60805 | -0.60805 | -0.60805 | -0.60805 |
| Tax Rate, % | 14.85 | 14.85 | 14.85 | 14.85 | 14.85 | 14.85 | 14.85 | 14.85 | 14.85 | 14.85 |
| EBITAT | 665.5 | 1,148.3 | 1,431.3 | 1,883.6 | 2,056.4 | 1,940.1 | 2,283.4 | 2,687.5 | 3,163.1 | 3,722.8 |
| Depreciation | ||||||||||
| Changes in Account Receivables | ||||||||||
| Changes in Inventories | ||||||||||
| Changes in Accounts Payable | ||||||||||
| Capital Expenditure | ||||||||||
| UFCF | 1,209.5 | -6,463.7 | 8,461.3 | 1,854.6 | 2,000.4 | 1,465.1 | 2,171.4 | 2,555.7 | 3,007.9 | 3,540.2 |
| WACC, % | 11.26 | 11.27 | 11.27 | 11.3 | 11.32 | 11.28 | 11.28 | 11.28 | 11.28 | 11.28 |
| PV UFCF | ||||||||||
| SUM PV UFCF | 8,960.2 | |||||||||
| Long Term Growth Rate, % | 2.00 | |||||||||
| Free cash flow (T + 1) | 3,611 | |||||||||
| Terminal Value | 38,900 | |||||||||
| Present Terminal Value | 22,794 | |||||||||
| Enterprise Value | 31,754 | |||||||||
| Net Debt | 207 | |||||||||
| Equity Value | 31,547 | |||||||||
| Diluted Shares Outstanding, MM | 1,678 | |||||||||
| Equity Value Per Share | 18.80 |
What You Will Get
- Pre-Filled Financial Model: Brookfield Asset Management Inc.'s (BAM) actual data facilitates accurate DCF valuation.
- Full Forecast Control: Modify revenue growth, profit margins, WACC, and other essential parameters.
- Instant Calculations: Real-time updates guarantee you see outcomes as you implement changes.
- Investor-Ready Template: A polished Excel file crafted for high-quality valuation analysis.
- Customizable and Reusable: Designed for adaptability, allowing repeated application for comprehensive forecasts.
Key Features
- Comprehensive Data: Brookfield’s historical financial statements and pre-filled projections.
- Customizable Inputs: Modify WACC, tax rates, revenue growth, and EBITDA margins as needed.
- Real-Time Analysis: Observe Brookfield’s intrinsic value recalculated instantly.
- Intuitive Visual Outputs: Dashboard charts illustrate valuation results and essential metrics.
- Designed for Precision: A professional-grade tool for analysts, investors, and finance professionals.
How It Works
- Step 1: Download the prebuilt Excel template with Brookfield Asset Management Inc.'s (BAM) data included.
- Step 2: Explore the pre-filled sheets and familiarize yourself with the essential metrics.
- Step 3: Update forecasts and assumptions in the editable yellow cells (WACC, growth, margins).
- Step 4: Instantly view recalculated results, including Brookfield Asset Management Inc.'s (BAM) intrinsic value.
- Step 5: Make informed investment decisions or generate reports using the outputs.
Why Choose Brookfield Asset Management (BAM)?
- Expertise: Leverage decades of experience in asset management for reliable insights.
- Versatility: Tailored solutions that accommodate a wide range of investment strategies.
- Efficiency: Streamlined processes that save you time and effort in managing investments.
- Institutional Quality: Built with the sophistication and rigor expected by institutional investors.
- Accessible: Designed for ease of use, catering to both seasoned investors and newcomers.
Who Should Use Brookfield Asset Management Inc. (BAM)?
- Investors: Gain insights for informed investment decisions with our comprehensive asset management services.
- Financial Analysts: Utilize our detailed reports and analyses to streamline your financial assessments.
- Consultants: Leverage our expertise to enhance client strategies and presentations.
- Finance Enthusiasts: Explore diverse investment opportunities and strategies through our resources.
- Educators and Students: Access valuable case studies and materials for finance education and research.
What the Template Contains
- Pre-Filled Data: Includes Brookfield Asset Management Inc.'s historical financials and forecasts.
- Discounted Cash Flow Model: Editable DCF valuation model with automatic calculations.
- Weighted Average Cost of Capital (WACC): A dedicated sheet for calculating WACC based on custom inputs.
- Key Financial Ratios: Analyze Brookfield Asset Management Inc.'s profitability, efficiency, and leverage.
- Customizable Inputs: Edit revenue growth, margins, and tax rates with ease.
- Clear Dashboard: Charts and tables summarizing key valuation results.
Disclaimer
All information, articles, and product details provided on this website are for general informational and educational purposes only. We do not claim any ownership over, nor do we intend to infringe upon, any trademarks, copyrights, logos, brand names, or other intellectual property mentioned or depicted on this site. Such intellectual property remains the property of its respective owners, and any references here are made solely for identification or informational purposes, without implying any affiliation, endorsement, or partnership.
We make no representations or warranties, express or implied, regarding the accuracy, completeness, or suitability of any content or products presented. Nothing on this website should be construed as legal, tax, investment, financial, medical, or other professional advice. In addition, no part of this site—including articles or product references—constitutes a solicitation, recommendation, endorsement, advertisement, or offer to buy or sell any securities, franchises, or other financial instruments, particularly in jurisdictions where such activity would be unlawful.
All content is of a general nature and may not address the specific circumstances of any individual or entity. It is not a substitute for professional advice or services. Any actions you take based on the information provided here are strictly at your own risk. You accept full responsibility for any decisions or outcomes arising from your use of this website and agree to release us from any liability in connection with your use of, or reliance upon, the content or products found herein.