
|
The Liberty Braves Group (BATRK) Valation DCF |
Entièrement Modifiable: Adapté À Vos Besoins Dans Excel Ou Sheets
Conception Professionnelle: Modèles Fiables Et Conformes Aux Normes Du Secteur
Pré-Construits Pour Une Utilisation Rapide Et Efficace
Compatible MAC/PC, entièrement débloqué
Aucune Expertise N'Est Requise; Facile À Suivre
The Liberty Braves Group (BATRK) Bundle
Conçu pour la précision, notre calculatrice DCF (BATRK) vous permet d'évaluer l'évaluation du Groupe Liberty Braves à l'aide de données financières à jour et offre une flexibilité complète pour modifier tous les paramètres essentiels pour une prévision améliorée.
What You'll Receive
- Customizable Excel Template: A fully adaptable Excel-based DCF Calculator featuring pre-filled financial data for The Liberty Braves Group (BATRK).
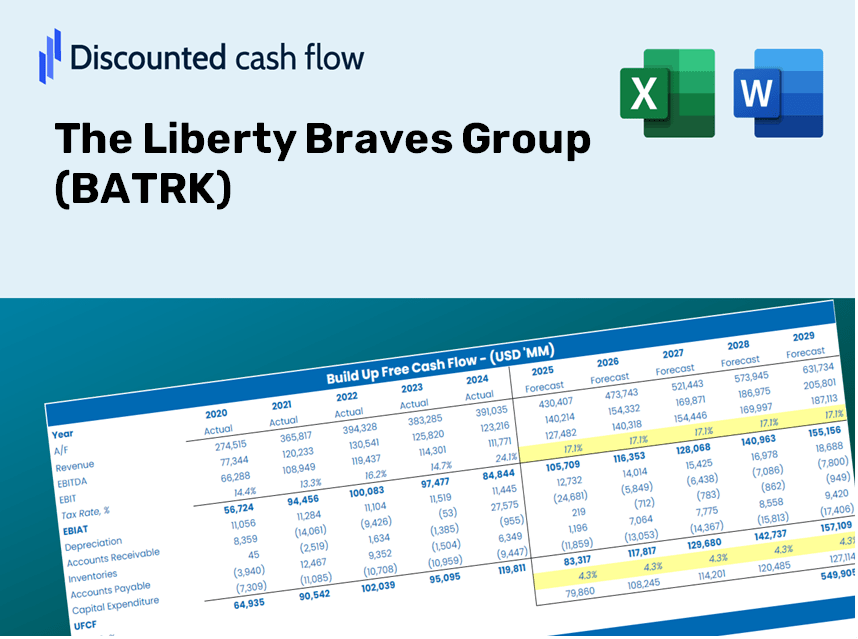
- Accurate Historical Data: Access to past performance data and future projections (highlighted in the yellow cells).
- Forecast Customization: Modify key assumptions such as revenue growth rates, EBITDA %, and WACC.
- Real-Time Calculations: Instantly observe how your inputs influence The Liberty Braves Group's (BATRK) valuation.
- Professional Resource: Designed for investors, CFOs, consultants, and financial analysts.
- Intuitive User Interface: Organized for clarity and ease of navigation, complete with step-by-step guidance.
Key Features
- Pre-Loaded Data: The Liberty Braves Group's historical financial statements and pre-filled forecasts.
- Fully Adjustable Inputs: Customize WACC, tax rates, revenue growth, and EBITDA margins.
- Instant Results: Watch the intrinsic value of The Liberty Braves Group (BATRK) update in real time.
- Clear Visual Outputs: Interactive dashboard charts showcase valuation results and essential metrics.
- Built for Accuracy: A professional-grade tool designed for analysts, investors, and finance professionals.
How It Operates
- 1. Access the Template: Download and open the Excel file featuring The Liberty Braves Group's (BATRK) preloaded data.
- 2. Adjust Assumptions: Modify essential parameters such as growth rates, WACC, and capital expenditures.
- 3. Get Instant Results: The DCF model automatically calculates the intrinsic value and NPV.
- 4. Explore Scenarios: Evaluate various projections to assess different valuation outcomes.
- 5. Present with Assurance: Deliver professional valuation insights to reinforce your investment decisions.
Why Choose This Calculator for The Liberty Braves Group (BATRK)?
- Designed for Experts: A sophisticated tool utilized by financial analysts, CFOs, and consultants.
- Accurate Data: Historical and projected financials for The Liberty Braves Group preloaded for precision.
- What-If Analysis: Effortlessly explore various forecasts and assumptions.
- Comprehensive Outputs: Automatically computes intrinsic value, NPV, and essential financial metrics.
- User-Friendly: Step-by-step guidance to help you navigate the analysis effectively.
Who Can Benefit from This Product?
- Investors: Accurately assess the fair value of The Liberty Braves Group (BATRK) prior to making investment choices.
- CFOs: Utilize a professional-grade DCF model for comprehensive financial reporting and analysis.
- Consultants: Effortlessly customize the template for client valuation reports.
- Entrepreneurs: Acquire valuable insights into the financial modeling practices of major corporations.
- Educators: Employ it as a teaching aid to illustrate various valuation techniques.
Contents of the Template
- Pre-Filled Data: Contains The Liberty Braves Group's historical financials and projections.
- Discounted Cash Flow Model: An editable DCF valuation model featuring automatic calculations.
- Weighted Average Cost of Capital (WACC): A specialized sheet for computing WACC based on user-defined inputs.
- Key Financial Ratios: Assess The Liberty Braves Group’s profitability, efficiency, and leverage.
- Customizable Inputs: Easily modify revenue growth, margins, and tax rates.
- Intuitive Dashboard: Visualizations and tables that summarize essential valuation outcomes.
Disclaimer
All information, articles, and product details provided on this website are for general informational and educational purposes only. We do not claim any ownership over, nor do we intend to infringe upon, any trademarks, copyrights, logos, brand names, or other intellectual property mentioned or depicted on this site. Such intellectual property remains the property of its respective owners, and any references here are made solely for identification or informational purposes, without implying any affiliation, endorsement, or partnership.
We make no representations or warranties, express or implied, regarding the accuracy, completeness, or suitability of any content or products presented. Nothing on this website should be construed as legal, tax, investment, financial, medical, or other professional advice. In addition, no part of this site—including articles or product references—constitutes a solicitation, recommendation, endorsement, advertisement, or offer to buy or sell any securities, franchises, or other financial instruments, particularly in jurisdictions where such activity would be unlawful.
All content is of a general nature and may not address the specific circumstances of any individual or entity. It is not a substitute for professional advice or services. Any actions you take based on the information provided here are strictly at your own risk. You accept full responsibility for any decisions or outcomes arising from your use of this website and agree to release us from any liability in connection with your use of, or reliance upon, the content or products found herein.