
|
Black Box Limited (Bbox.NS) Évaluation DCF |
Entièrement Modifiable: Adapté À Vos Besoins Dans Excel Ou Sheets
Conception Professionnelle: Modèles Fiables Et Conformes Aux Normes Du Secteur
Pré-Construits Pour Une Utilisation Rapide Et Efficace
Compatible MAC/PC, entièrement débloqué
Aucune Expertise N'Est Requise; Facile À Suivre
Black Box Limited (BBOX.NS) Bundle
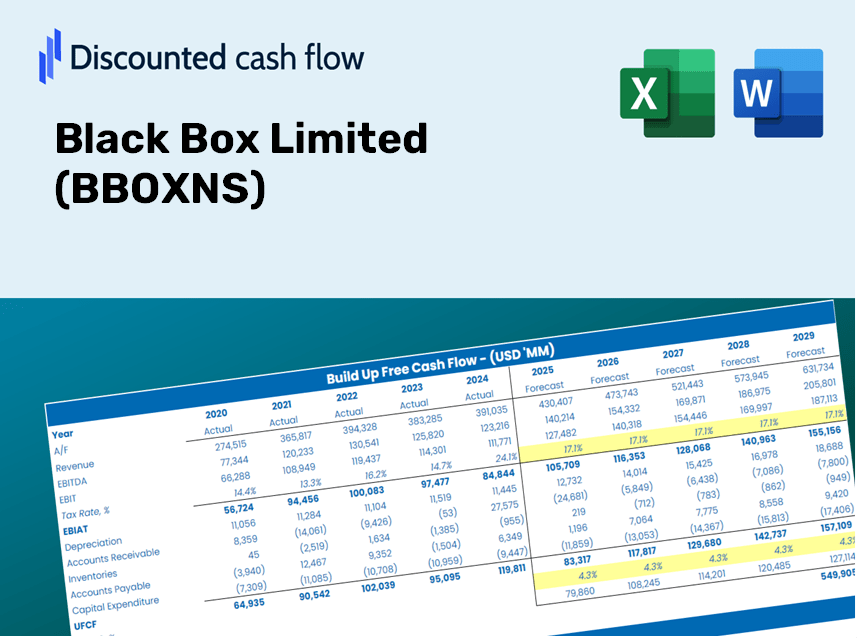
Que vous soyez un investisseur ou un analyste, cette calculatrice DCF (BBOXNS) est votre ressource incontournable pour une évaluation précise. Chargé de données réelles de Black Box Limited, vous pouvez ajuster les prévisions et observer instantanément les effets.
Discounted Cash Flow (DCF) - (USD MM)
| Year | AY1 2021 |
AY2 2022 |
AY3 2023 |
AY4 2024 |
AY5 2025 |
FY1 2026 |
FY2 2027 |
FY3 2028 |
FY4 2029 |
FY5 2030 |
|---|---|---|---|---|---|---|---|---|---|---|
| Revenue | 46,740.2 | 53,701.7 | 62,875.6 | 62,815.8 | 59,669.1 | 63,677.8 | 67,955.7 | 72,521.1 | 77,393.2 | 82,592.5 |
| Revenue Growth, % | 0 | 14.89 | 17.08 | -0.09510844 | -5.01 | 6.72 | 6.72 | 6.72 | 6.72 | 6.72 |
| EBITDA | 2,946.5 | 1,950.6 | 1,916.8 | 3,444.1 | 4,553.4 | 3,323.8 | 3,547.1 | 3,785.4 | 4,039.7 | 4,311.1 |
| EBITDA, % | 6.3 | 3.63 | 3.05 | 5.48 | 7.63 | 5.22 | 5.22 | 5.22 | 5.22 | 5.22 |
| Depreciation | 257.3 | 354.4 | 259.9 | 325.5 | 311.8 | 339.3 | 362.1 | 386.5 | 412.4 | 440.1 |
| Depreciation, % | 0.55049 | 0.65994 | 0.41336 | 0.51818 | 0.52255 | 0.5329 | 0.5329 | 0.5329 | 0.5329 | 0.5329 |
| EBIT | 2,689.2 | 1,596.2 | 1,656.9 | 3,118.6 | 4,241.6 | 2,984.5 | 3,185.0 | 3,399.0 | 3,627.3 | 3,871.0 |
| EBIT, % | 5.75 | 2.97 | 2.64 | 4.96 | 7.11 | 4.69 | 4.69 | 4.69 | 4.69 | 4.69 |
| Total Cash | 5,392.6 | 3,010.4 | 8,923.8 | 2,160.7 | 7,783.5 | 6,090.2 | 6,499.3 | 6,935.9 | 7,401.9 | 7,899.2 |
| Total Cash, percent | .0 | .0 | .0 | .0 | .0 | .0 | .0 | .0 | .0 | .0 |
| Account Receivables | 6,294.3 | 9,307.7 | 10,958.9 | 11,353.8 | 7,857.0 | 10,121.0 | 10,801.0 | 11,526.6 | 12,301.0 | 13,127.4 |
| Account Receivables, % | 13.47 | 17.33 | 17.43 | 18.07 | 13.17 | 15.89 | 15.89 | 15.89 | 15.89 | 15.89 |
| Inventories | 1,487.5 | 2,259.4 | 3,620.0 | 2,463.9 | 2,096.9 | 2,621.5 | 2,797.6 | 2,985.5 | 3,186.1 | 3,400.1 |
| Inventories, % | 3.18 | 4.21 | 5.76 | 3.92 | 3.51 | 4.12 | 4.12 | 4.12 | 4.12 | 4.12 |
| Accounts Payable | 5,156.1 | 10,088.7 | 11,581.3 | 6,989.5 | 5,555.8 | 8,746.2 | 9,333.8 | 9,960.8 | 10,630.0 | 11,344.1 |
| Accounts Payable, % | 11.03 | 18.79 | 18.42 | 11.13 | 9.31 | 13.74 | 13.74 | 13.74 | 13.74 | 13.74 |
| Capital Expenditure | -298.5 | -510.6 | -983.4 | -507.2 | -443.8 | -599.2 | -639.4 | -682.4 | -728.2 | -777.1 |
| Capital Expenditure, % | -0.63864 | -0.95081 | -1.56 | -0.80744 | -0.74377 | -0.94094 | -0.94094 | -0.94094 | -0.94094 | -0.94094 |
| Tax Rate, % | 3.34 | 3.34 | 3.34 | 3.34 | 3.34 | 3.34 | 3.34 | 3.34 | 3.34 | 3.34 |
| EBITAT | 2,187.7 | 1,350.0 | 1,333.4 | 2,745.3 | 4,099.9 | 2,573.2 | 2,746.1 | 2,930.5 | 3,127.4 | 3,337.5 |
| Depreciation | ||||||||||
| Changes in Account Receivables | ||||||||||
| Changes in Inventories | ||||||||||
| Changes in Accounts Payable | ||||||||||
| Capital Expenditure | ||||||||||
| UFCF | -479.2 | 2,341.1 | -909.3 | -1,267.0 | 6,398.0 | 2,715.1 | 2,200.3 | 2,348.1 | 2,505.9 | 2,674.2 |
| WACC, % | 5.39 | 5.44 | 5.38 | 5.49 | 5.61 | 5.46 | 5.46 | 5.46 | 5.46 | 5.46 |
| PV UFCF | ||||||||||
| SUM PV UFCF | 10,630.5 | |||||||||
| Long Term Growth Rate, % | 3.00 | |||||||||
| Free cash flow (T + 1) | 2,754 | |||||||||
| Terminal Value | 111,934 | |||||||||
| Present Terminal Value | 85,804 | |||||||||
| Enterprise Value | 96,434 | |||||||||
| Net Debt | 7,127 | |||||||||
| Equity Value | 89,307 | |||||||||
| Diluted Shares Outstanding, MM | 171 | |||||||||
| Equity Value Per Share | 522.34 |
Your Benefits
- Authentic BBOXNS Financial Data: Comes pre-loaded with Black Box Limited’s historical and forecasted data for in-depth analysis.
- Completely Customizable Template: Easily adjust vital inputs like revenue growth, WACC, and EBITDA percentage.
- Real-Time Calculations: Watch BBOXNS's intrinsic value refresh instantly as you make adjustments.
- Expert Valuation Tool: Crafted for investors, analysts, and consultants aiming for precise DCF outcomes.
- Intuitive User Interface: Designed with a straightforward layout and clear guidance for users of all experience levels.
Core Attributes of Black Box Limited (BBOXNS)
- Accurate Financial Data: Gain access to reliable historical records and future forecasts.
- Tailorable Forecast Inputs: Modify yellow-highlighted fields such as WACC, growth rates, and profit margins.
- Real-Time Calculations: Automatic adjustments for DCF, Net Present Value (NPV), and cash flow evaluations.
- User-Friendly Dashboard: Clear charts and summaries to help you visualize valuation outcomes.
- Designed for All Skill Levels: An intuitive layout suitable for investors, CFOs, and consultants alike.
How It Functions
- Step 1: Download the Excel spreadsheet.
- Step 2: Examine the pre-filled financial data and projections for Black Box Limited (BBOXNS).
- Step 3: Adjust key inputs such as revenue growth, WACC, and tax rates (cells highlighted for easy modification).
- Step 4: Observe the DCF model refresh in real-time as you make changes to your assumptions.
- Step 5: Evaluate the outcomes and leverage the findings for your investment strategies.
Why Opt for the Black Box Limited (BBOXNS) Calculator?
- Time Efficiency: Skip the hassle of building a DCF model from the ground up – our tool is ready for immediate use.
- Enhanced Accuracy: Dependable financial data and robust formulas minimize valuation errors.
- Completely Customizable: Adjust the model to align with your unique assumptions and forecasts.
- User-Friendly Design: Intuitive charts and outputs facilitate easy analysis of results.
- Endorsed by Experts: Crafted for professionals who prioritize precision and ease of use.
Who Should Utilize Black Box Limited (BBOXNS)?
- Investors: Accurately assess the fair value of Black Box Limited (BBOXNS) before making investment choices.
- CFOs: Utilize a professional-grade DCF model for comprehensive financial reporting and analysis.
- Consultants: Efficiently customize the template for valuation reports tailored to client needs.
- Entrepreneurs: Discover insights into financial modeling employed by leading companies.
- Educators: Employ it as a teaching resource to illustrate valuation techniques.
What the Template Contains
- Preloaded BBOXNS Data: Historical and projected financial information, including revenue, EBIT, and capital expenditures.
- DCF and WACC Models: Advanced sheets designed for calculating intrinsic value and Weighted Average Cost of Capital.
- Editable Inputs: Cells highlighted in yellow for modifying revenue growth, tax rates, and discount rates.
- Financial Statements: Detailed annual and quarterly financial reports for in-depth analysis.
- Key Ratios: Ratios measuring profitability, leverage, and efficiency to assess performance.
- Dashboard and Charts: Visual representations of valuation conclusions and underlying assumptions.
Disclaimer
All information, articles, and product details provided on this website are for general informational and educational purposes only. We do not claim any ownership over, nor do we intend to infringe upon, any trademarks, copyrights, logos, brand names, or other intellectual property mentioned or depicted on this site. Such intellectual property remains the property of its respective owners, and any references here are made solely for identification or informational purposes, without implying any affiliation, endorsement, or partnership.
We make no representations or warranties, express or implied, regarding the accuracy, completeness, or suitability of any content or products presented. Nothing on this website should be construed as legal, tax, investment, financial, medical, or other professional advice. In addition, no part of this site—including articles or product references—constitutes a solicitation, recommendation, endorsement, advertisement, or offer to buy or sell any securities, franchises, or other financial instruments, particularly in jurisdictions where such activity would be unlawful.
All content is of a general nature and may not address the specific circumstances of any individual or entity. It is not a substitute for professional advice or services. Any actions you take based on the information provided here are strictly at your own risk. You accept full responsibility for any decisions or outcomes arising from your use of this website and agree to release us from any liability in connection with your use of, or reliance upon, the content or products found herein.