
|
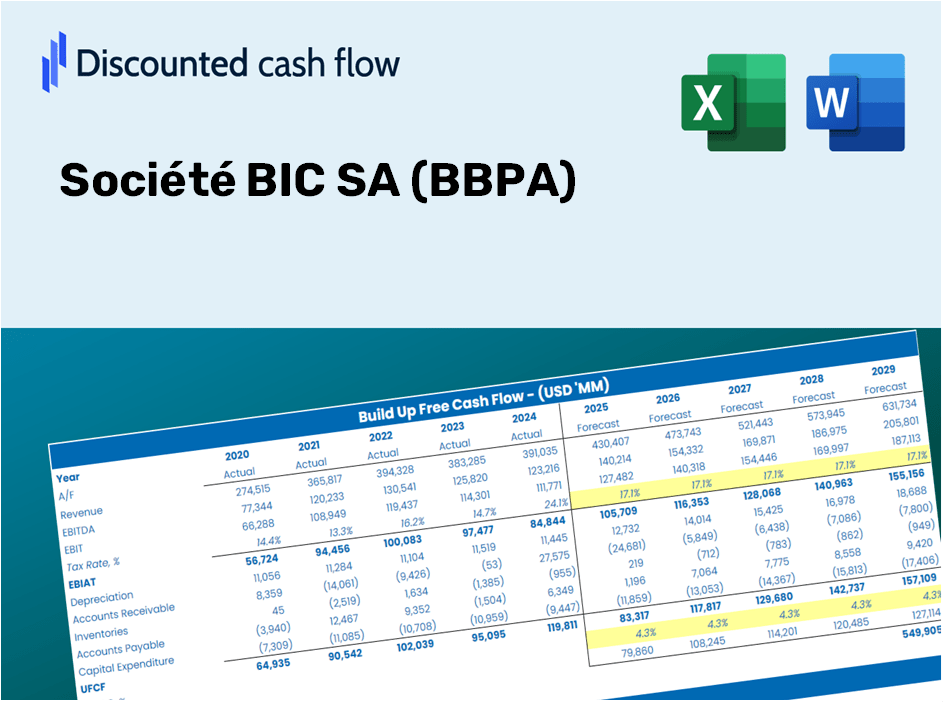
Société BIC SA (BB.PA) Évaluation DCF |
Entièrement Modifiable: Adapté À Vos Besoins Dans Excel Ou Sheets
Conception Professionnelle: Modèles Fiables Et Conformes Aux Normes Du Secteur
Pré-Construits Pour Une Utilisation Rapide Et Efficace
Compatible MAC/PC, entièrement débloqué
Aucune Expertise N'Est Requise; Facile À Suivre
Société BIC SA (BB.PA) Bundle
Vous cherchez à déterminer la valeur intrinsèque de Société Bic SA? Notre calculatrice (BBPA) DCF intègre des données réelles avec des fonctionnalités de personnalisation complètes, vous permettant d'affiner vos prévisions et d'améliorer votre prise de décision d'investissement.
What You Will Receive
- Authentic BIC Financials: Features comprehensive historical and projected data for precise valuation.
- Customizable Inputs: Adjust WACC, tax rates, revenue growth, and capital expenditures as needed.
- Automated Calculations: Intrinsic value and NPV are computed in real-time.
- Scenario Analysis: Explore various scenarios to assess BIC's future performance.
- User-Friendly Design: Designed for professionals but easy for beginners to navigate.
Key Features of Société BIC SA (BBPA)
- Accurate Financial Data: Gain access to reliable historical information and future forecasts specific to Société BIC SA (BBPA).
- Tailored Assumptions for Forecasting: Modify the highlighted cells, including WACC, growth rates, and profit margins, to fit your analysis.
- Automated Calculations: Enjoy real-time updates on DCF, Net Present Value (NPV), and cash flow assessments.
- User-Friendly Dashboard: Utilize clear charts and summaries to effectively visualize your valuation results.
- Accessible for All Skill Levels: Designed with a straightforward layout suitable for investors, CFOs, and consultants alike.
How It Works
- 1. Access the Template: Download and open the Excel spreadsheet containing Société BIC SA’s (BBPA) preloaded data.
- 2. Modify Assumptions: Adjust essential inputs such as growth rates, WACC, and capital expenditures.
- 3. View Results Immediately: The DCF model will automatically calculate intrinsic value and NPV in real time.
- 4. Explore Scenarios: Evaluate multiple forecasts to investigate various valuation outcomes.
- 5. Present with Assurance: Deliver professional valuation insights to inform your decision-making process.
Why Opt for This Calculator?
- Accurate Data: Utilize real Société BIC SA (BBPA) financials for trustworthy valuation outcomes.
- Customizable: Modify essential parameters such as growth rates, WACC, and tax rates to align with your forecasts.
- Time-Saving: Built-in calculations save you the hassle of starting from the ground up.
- Professional-Grade Tool: Tailored for investors, analysts, and consultants alike.
- User-Friendly: Streamlined interface and clear, step-by-step guidance ensure accessibility for all users.
Who Should Utilize This Product?
- Individual Investors: Gain insights to make informed decisions about purchasing or selling Société BIC SA (BBPA) stock.
- Financial Analysts: Enhance valuation processes with accessible financial models tailored for Société BIC SA (BBPA).
- Consultants: Provide clients with accurate and timely valuation insights on Société BIC SA (BBPA).
- Business Owners: Learn how major corporations like Société BIC SA (BBPA) are valued to inform your strategic decisions.
- Finance Students: Acquire valuation skills through practical examples using data from Société BIC SA (BBPA).
What the Template Includes
- Operating and Balance Sheet Data: Pre-filled historical data and forecasts for Société BIC SA (BBPA), covering revenue, EBITDA, EBIT, and capital expenditures.
- WACC Calculation: A dedicated sheet for calculating the Weighted Average Cost of Capital (WACC), featuring parameters such as Beta, risk-free rate, and share price.
- DCF Valuation (Unlevered and Levered): Customizable Discounted Cash Flow models that display intrinsic value alongside detailed calculations.
- Financial Statements: Pre-loaded annual and quarterly financial statements to facilitate comprehensive analysis.
- Key Ratios: A collection of profitability, leverage, and efficiency ratios specifically for Société BIC SA (BBPA).
- Dashboard and Charts: A visual overview of valuation outputs and assumptions to simplify result analysis.
Disclaimer
All information, articles, and product details provided on this website are for general informational and educational purposes only. We do not claim any ownership over, nor do we intend to infringe upon, any trademarks, copyrights, logos, brand names, or other intellectual property mentioned or depicted on this site. Such intellectual property remains the property of its respective owners, and any references here are made solely for identification or informational purposes, without implying any affiliation, endorsement, or partnership.
We make no representations or warranties, express or implied, regarding the accuracy, completeness, or suitability of any content or products presented. Nothing on this website should be construed as legal, tax, investment, financial, medical, or other professional advice. In addition, no part of this site—including articles or product references—constitutes a solicitation, recommendation, endorsement, advertisement, or offer to buy or sell any securities, franchises, or other financial instruments, particularly in jurisdictions where such activity would be unlawful.
All content is of a general nature and may not address the specific circumstances of any individual or entity. It is not a substitute for professional advice or services. Any actions you take based on the information provided here are strictly at your own risk. You accept full responsibility for any decisions or outcomes arising from your use of this website and agree to release us from any liability in connection with your use of, or reliance upon, the content or products found herein.