
|
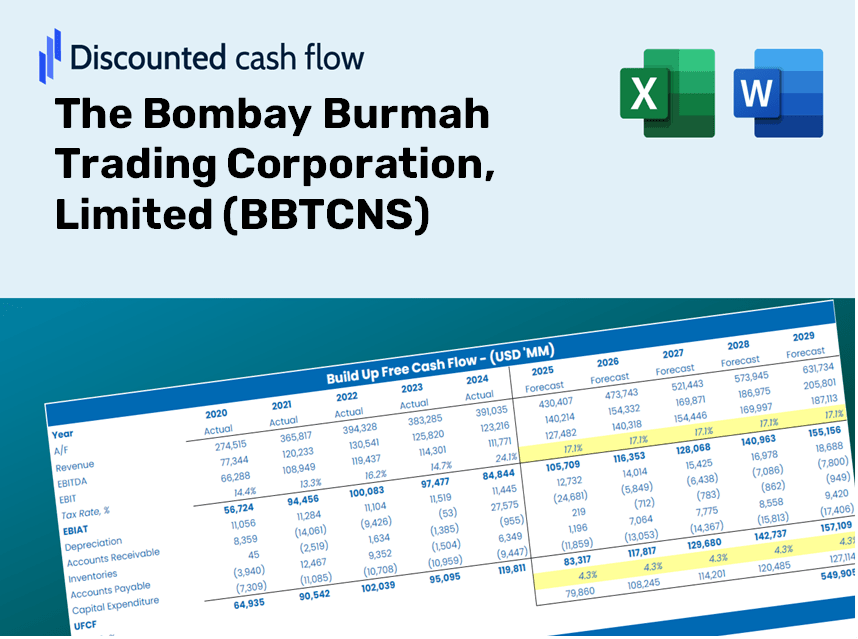
The Bombay Burmah Trading Corporation, Limited (BBTC.NS) DCF Valeure |
Entièrement Modifiable: Adapté À Vos Besoins Dans Excel Ou Sheets
Conception Professionnelle: Modèles Fiables Et Conformes Aux Normes Du Secteur
Pré-Construits Pour Une Utilisation Rapide Et Efficace
Compatible MAC/PC, entièrement débloqué
Aucune Expertise N'Est Requise; Facile À Suivre
The Bombay Burmah Trading Corporation, Limited (BBTC.NS) Bundle
Rationalisez votre analyse et augmentez la précision avec notre calculatrice DCF (BBTCNS)! En utilisant des données réelles de la Bombay Burmah Trading Corporation, des hypothèses limitées et personnalisables, cet outil vous permet de prévoir, d'évaluer et d'évaluer (BBTCN) comme un investisseur chevronné.
What You Will Receive
- Customizable Excel Template: An adaptable Excel-based DCF Calculator featuring pre-entered financial data for BBTCNS.
- Current Data: Access to historical figures and predictive estimates (highlighted in the yellow cells).
- Flexible Forecasting: Modify forecasting variables such as revenue growth, EBITDA %, and WACC.
- Real-Time Calculations: Instantly observe how your adjustments affect the valuation of The Bombay Burmah Trading Corporation, Limited (BBTCNS).
- Professional Resource: Designed for investors, CFOs, consultants, and financial analysts.
- User-Centric Design: Organized for simplicity and effectiveness, complete with comprehensive instructions.
Key Features
- Real-Life BBTCNS Data: Pre-populated with the historical financials and future projections of The Bombay Burmah Trading Corporation, Limited.
- Fully Customizable Inputs: Tailor revenue growth, profit margins, WACC, tax rates, and capital expenditures to fit your analysis.
- Dynamic Valuation Model: Automatic recalibrations of Net Present Value (NPV) and intrinsic value in response to your modifications.
- Scenario Testing: Develop various forecasting scenarios to evaluate different valuation possibilities.
- User-Friendly Design: Intuitive layout crafted for both professionals and novices.
How It Works
- Download the Template: Get instant access to the Excel-based BBTCNS DCF Calculator.
- Input Your Assumptions: Modify the yellow-highlighted cells for growth rates, WACC, margins, and other variables.
- Instant Calculations: The model automatically refreshes to show the intrinsic value of Bombay Burmah Trading Corporation.
- Test Scenarios: Experiment with various assumptions to analyze potential valuation shifts.
- Analyze and Decide: Utilize the results to inform your investment or financial strategy.
Why Choose This Calculator for The Bombay Burmah Trading Corporation, Limited (BBTCNS)?
- User-Friendly Interface: Tailored for both novices and seasoned users.
- Customizable Inputs: Modify parameters effortlessly to suit your analysis needs.
- Real-Time Valuation: Instantly view changes to BBTCNS’s valuation as you adjust the inputs.
- Preloaded Financials: Comes equipped with BBTCNS’s latest financial data for swift evaluations.
- Relied Upon by Experts: Utilized by investors and financial analysts to guide sound decision-making.
Who Should Benefit from This Product?
- Investors: Identify the intrinsic value of The Bombay Burmah Trading Corporation, Limited (BBTCNS) before making investment choices.
- CFOs: Utilize a top-tier DCF model for thorough financial reporting and analysis.
- Consultants: Easily customize the template for client valuation reports.
- Entrepreneurs: Discover financial modeling techniques embraced by leading companies.
- Educators: Incorporate it as a resource to teach valuation strategies effectively.
Contents of the Template
- Preloaded BBTCNS Data: Historical and projected financial figures, including revenue, EBIT, and capital expenditures.
- DCF and WACC Models: Professional templates designed for calculating intrinsic value and Weighted Average Cost of Capital.
- Editable Inputs: Yellow-highlighted cells for modifying revenue growth, tax rates, and discount rates.
- Financial Statements: Detailed annual and quarterly financial reports for in-depth analysis.
- Key Ratios: Metrics on profitability, leverage, and efficiency for performance assessment.
- Dashboard and Charts: Visual representations of valuation results and underlying assumptions.
Disclaimer
All information, articles, and product details provided on this website are for general informational and educational purposes only. We do not claim any ownership over, nor do we intend to infringe upon, any trademarks, copyrights, logos, brand names, or other intellectual property mentioned or depicted on this site. Such intellectual property remains the property of its respective owners, and any references here are made solely for identification or informational purposes, without implying any affiliation, endorsement, or partnership.
We make no representations or warranties, express or implied, regarding the accuracy, completeness, or suitability of any content or products presented. Nothing on this website should be construed as legal, tax, investment, financial, medical, or other professional advice. In addition, no part of this site—including articles or product references—constitutes a solicitation, recommendation, endorsement, advertisement, or offer to buy or sell any securities, franchises, or other financial instruments, particularly in jurisdictions where such activity would be unlawful.
All content is of a general nature and may not address the specific circumstances of any individual or entity. It is not a substitute for professional advice or services. Any actions you take based on the information provided here are strictly at your own risk. You accept full responsibility for any decisions or outcomes arising from your use of this website and agree to release us from any liability in connection with your use of, or reliance upon, the content or products found herein.