
|
Boise Cascade Company (BCC) Évaluation DCF |
Entièrement Modifiable: Adapté À Vos Besoins Dans Excel Ou Sheets
Conception Professionnelle: Modèles Fiables Et Conformes Aux Normes Du Secteur
Pré-Construits Pour Une Utilisation Rapide Et Efficace
Compatible MAC/PC, entièrement débloqué
Aucune Expertise N'Est Requise; Facile À Suivre
Boise Cascade Company (BCC) Bundle
Améliorez vos choix d'investissement avec la calculatrice DCF Boise Cascade Company (BCC)! Obtenez des données financières réelles pour Boise Cascade, ajustez les prédictions et les dépenses de croissance et observez instantanément comment ces changements affectent la valeur intrinsèque de Boise Cascade Company (BCC).
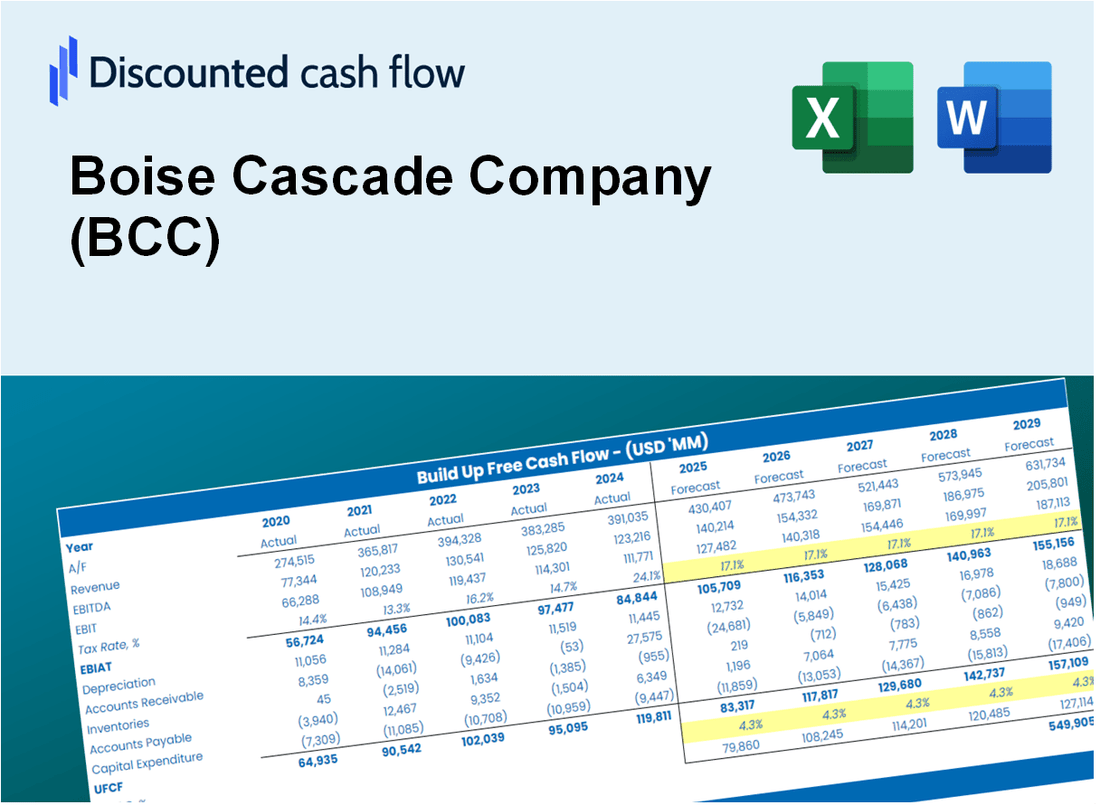
Discounted Cash Flow (DCF) - (USD MM)
| Year | AY1 2020 |
AY2 2021 |
AY3 2022 |
AY4 2023 |
AY5 2024 |
FY1 2025 |
FY2 2026 |
FY3 2027 |
FY4 2028 |
FY5 2029 |
|---|---|---|---|---|---|---|---|---|---|---|
| Revenue | 5,474.8 | 7,926.1 | 8,387.3 | 6,838.2 | 6,724.3 | 7,236.3 | 7,787.3 | 8,380.2 | 9,018.3 | 9,705.0 |
| Revenue Growth, % | 0 | 44.77 | 5.82 | -18.47 | -1.67 | 7.61 | 7.61 | 7.61 | 7.61 | 7.61 |
| EBITDA | 409.7 | 1,056.1 | 1,275.7 | 806.0 | 673.2 | 836.7 | 900.4 | 969.0 | 1,042.8 | 1,122.2 |
| EBITDA, % | 7.48 | 13.32 | 15.21 | 11.79 | 10.01 | 11.56 | 11.56 | 11.56 | 11.56 | 11.56 |
| Depreciation | 97.1 | 82.5 | 103.9 | 135.4 | 147.4 | 119.0 | 128.1 | 137.9 | 148.4 | 159.7 |
| Depreciation, % | 1.77 | 1.04 | 1.24 | 1.98 | 2.19 | 1.65 | 1.65 | 1.65 | 1.65 | 1.65 |
| EBIT | 312.5 | 973.7 | 1,171.8 | 670.5 | 525.8 | 717.7 | 772.3 | 831.1 | 894.4 | 962.5 |
| EBIT, % | 5.71 | 12.28 | 13.97 | 9.81 | 7.82 | 9.92 | 9.92 | 9.92 | 9.92 | 9.92 |
| Total Cash | 405.4 | 748.9 | 998.3 | 949.6 | 713.3 | 770.7 | 829.3 | 892.5 | 960.4 | 1,033.6 |
| Total Cash, percent | .0 | .0 | .0 | .0 | .0 | .0 | .0 | .0 | .0 | .0 |
| Account Receivables | 391.1 | 462.2 | 320.3 | 373.7 | 344.8 | 396.4 | 426.5 | 459.0 | 494.0 | 531.6 |
| Account Receivables, % | 7.14 | 5.83 | 3.82 | 5.46 | 5.13 | 5.48 | 5.48 | 5.48 | 5.48 | 5.48 |
| Inventories | 503.5 | 660.7 | 697.6 | 712.4 | 803.3 | 697.8 | 750.9 | 808.1 | 869.6 | 935.8 |
| Inventories, % | 9.2 | 8.34 | 8.32 | 10.42 | 11.95 | 9.64 | 9.64 | 9.64 | 9.64 | 9.64 |
| Accounts Payable | 308.9 | 335.0 | 269.8 | 310.2 | 297.7 | 319.1 | 343.4 | 369.5 | 397.7 | 427.9 |
| Accounts Payable, % | 5.64 | 4.23 | 3.22 | 4.54 | 4.43 | 4.41 | 4.41 | 4.41 | 4.41 | 4.41 |
| Capital Expenditure | -79.4 | -106.5 | -114.1 | -215.4 | -229.6 | -155.1 | -167.0 | -179.7 | -193.3 | -208.1 |
| Capital Expenditure, % | -1.45 | -1.34 | -1.36 | -3.15 | -3.41 | -2.14 | -2.14 | -2.14 | -2.14 | -2.14 |
| Tax Rate, % | 24.99 | 24.99 | 24.99 | 24.99 | 24.99 | 24.99 | 24.99 | 24.99 | 24.99 | 24.99 |
| EBITAT | 191.0 | 731.1 | 876.7 | 502.8 | 394.4 | 518.2 | 557.6 | 600.1 | 645.8 | 695.0 |
| Depreciation | ||||||||||
| Changes in Account Receivables | ||||||||||
| Changes in Inventories | ||||||||||
| Changes in Accounts Payable | ||||||||||
| Capital Expenditure | ||||||||||
| UFCF | -377.1 | 504.9 | 906.3 | 394.9 | 237.7 | 557.4 | 459.8 | 494.8 | 532.5 | 573.0 |
| WACC, % | 8.55 | 8.66 | 8.65 | 8.65 | 8.65 | 8.63 | 8.63 | 8.63 | 8.63 | 8.63 |
| PV UFCF | ||||||||||
| SUM PV UFCF | 2,049.7 | |||||||||
| Long Term Growth Rate, % | 0.50 | |||||||||
| Free cash flow (T + 1) | 576 | |||||||||
| Terminal Value | 7,080 | |||||||||
| Present Terminal Value | 4,680 | |||||||||
| Enterprise Value | 6,729 | |||||||||
| Net Debt | -197 | |||||||||
| Equity Value | 6,926 | |||||||||
| Diluted Shares Outstanding, MM | 39 | |||||||||
| Equity Value Per Share | 176.17 |
What You Will Receive
- Customizable Excel Template: A fully editable Excel-based DCF Calculator featuring pre-loaded real BCC financials.
- Actual Data: Historical figures and future projections (highlighted in the yellow cells).
- Adjustable Forecasts: Modify assumptions such as revenue growth, EBITDA %, and WACC.
- Instant Calculations: Quickly observe how your inputs affect Boise Cascade's valuation.
- Professional Resource: Designed for investors, CFOs, consultants, and financial analysts.
- Intuitive Layout: Organized for clarity and simplicity, complete with step-by-step guidance.
Key Features
- Comprehensive DCF Calculator: Features detailed unlevered and levered DCF valuation models tailored for Boise Cascade Company (BCC).
- WACC Calculator: Pre-configured Weighted Average Cost of Capital sheet with adjustable inputs specific to Boise Cascade Company (BCC).
- Customizable Forecast Assumptions: Adjust growth rates, capital expenditures, and discount rates to fit Boise Cascade Company (BCC) projections.
- Integrated Financial Ratios: Evaluate profitability, leverage, and efficiency ratios relevant to Boise Cascade Company (BCC).
- Interactive Dashboard and Charts: Visual representations summarize essential valuation metrics for straightforward analysis of Boise Cascade Company (BCC).
How It Works
- Step 1: Download the Excel file.
- Step 2: Review pre-entered Boise Cascade Company (BCC) data (historical and projected).
- Step 3: Adjust key assumptions (yellow cells) based on your analysis.
- Step 4: View automatic recalculations for Boise Cascade Company’s intrinsic value.
- Step 5: Use the outputs for investment decisions or reporting.
Why Choose This Calculator for Boise Cascade Company (BCC)?
- Accuracy: Utilizes real Boise Cascade financials for precise data.
- Flexibility: Allows users to easily test and adjust inputs as needed.
- Time-Saving: Avoid the complexities of creating a DCF model from the ground up.
- Professional-Grade: Crafted with the expertise and usability expected by CFOs.
- User-Friendly: Intuitive design makes it accessible for users without extensive financial modeling skills.
Who Should Use This Product?
- Finance Students: Master valuation techniques and apply them using real-world data from Boise Cascade Company (BCC).
- Academics: Integrate industry-standard models into your coursework or research focused on Boise Cascade Company (BCC).
- Investors: Validate your assumptions and evaluate valuation outcomes for Boise Cascade Company (BCC) stock.
- Analysts: Enhance your efficiency with a customizable DCF model tailored for Boise Cascade Company (BCC).
- Small Business Owners: Understand the analytical methods used for evaluating large public companies like Boise Cascade Company (BCC).
What the Template Contains
- Preloaded BCC Data: Historical and projected financial data, including revenue, EBIT, and capital expenditures.
- DCF and WACC Models: Professional-grade sheets for calculating intrinsic value and Weighted Average Cost of Capital.
- Editable Inputs: Yellow-highlighted cells for adjusting revenue growth, tax rates, and discount rates.
- Financial Statements: Comprehensive annual and quarterly financials for deeper analysis.
- Key Ratios: Profitability, leverage, and efficiency ratios to evaluate performance.
- Dashboard and Charts: Visual summaries of valuation outcomes and assumptions.
Disclaimer
All information, articles, and product details provided on this website are for general informational and educational purposes only. We do not claim any ownership over, nor do we intend to infringe upon, any trademarks, copyrights, logos, brand names, or other intellectual property mentioned or depicted on this site. Such intellectual property remains the property of its respective owners, and any references here are made solely for identification or informational purposes, without implying any affiliation, endorsement, or partnership.
We make no representations or warranties, express or implied, regarding the accuracy, completeness, or suitability of any content or products presented. Nothing on this website should be construed as legal, tax, investment, financial, medical, or other professional advice. In addition, no part of this site—including articles or product references—constitutes a solicitation, recommendation, endorsement, advertisement, or offer to buy or sell any securities, franchises, or other financial instruments, particularly in jurisdictions where such activity would be unlawful.
All content is of a general nature and may not address the specific circumstances of any individual or entity. It is not a substitute for professional advice or services. Any actions you take based on the information provided here are strictly at your own risk. You accept full responsibility for any decisions or outcomes arising from your use of this website and agree to release us from any liability in connection with your use of, or reliance upon, the content or products found herein.