
|
BEML LIMITED (BEML.NS) Évaluation DCF |
Entièrement Modifiable: Adapté À Vos Besoins Dans Excel Ou Sheets
Conception Professionnelle: Modèles Fiables Et Conformes Aux Normes Du Secteur
Pré-Construits Pour Une Utilisation Rapide Et Efficace
Compatible MAC/PC, entièrement débloqué
Aucune Expertise N'Est Requise; Facile À Suivre
BEML Limited (BEML.NS) Bundle
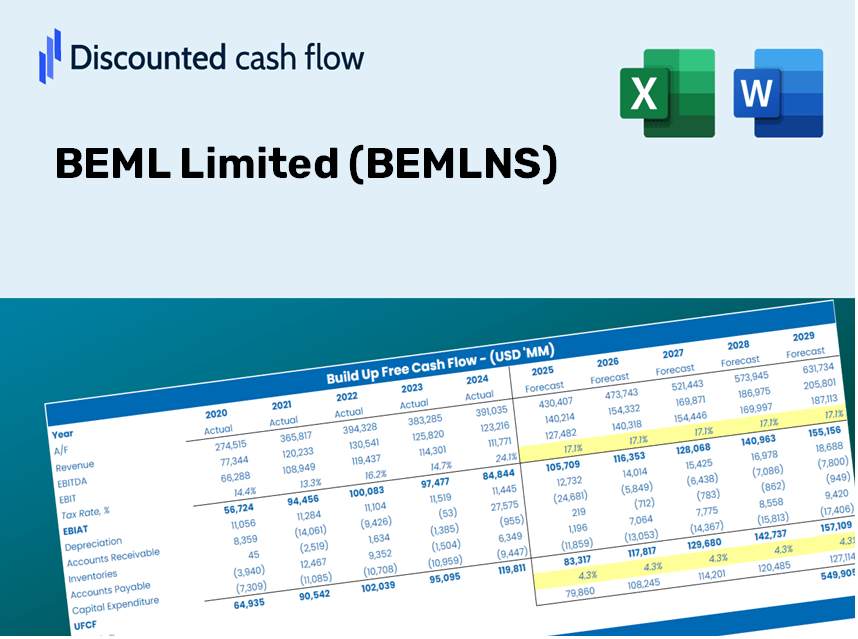
Que vous soyez un investisseur ou un analyste, cette calculatrice (BEMLNS) DCF est votre ressource incontournable pour une évaluation précise. Préchargé avec des données réelles de BEML Limited, vous pouvez ajuster les prévisions et observer instantanément les effets.
Discounted Cash Flow (DCF) - (USD MM)
| Year | AY1 2021 |
AY2 2022 |
AY3 2023 |
AY4 2024 |
AY5 2025 |
FY1 2026 |
FY2 2027 |
FY3 2028 |
FY4 2029 |
FY5 2030 |
|---|---|---|---|---|---|---|---|---|---|---|
| Revenue | 35,968.3 | 43,374.9 | 38,989.5 | 39,653.8 | 40,459.5 | 41,897.5 | 43,386.7 | 44,928.8 | 46,525.7 | 48,179.3 |
| Revenue Growth, % | 0 | 20.59 | -10.11 | 1.7 | 2.03 | 3.55 | 3.55 | 3.55 | 3.55 | 3.55 |
| EBITDA | 1,979.0 | 3,308.1 | 3,880.4 | 4,868.7 | 5,294.1 | 4,059.4 | 4,203.7 | 4,353.1 | 4,507.8 | 4,668.0 |
| EBITDA, % | 5.5 | 7.63 | 9.95 | 12.28 | 13.08 | 9.69 | 9.69 | 9.69 | 9.69 | 9.69 |
| Depreciation | 713.8 | 664.5 | 640.8 | 638.3 | 713.4 | 715.0 | 740.5 | 766.8 | 794.0 | 822.2 |
| Depreciation, % | 1.98 | 1.53 | 1.64 | 1.61 | 1.76 | 1.71 | 1.71 | 1.71 | 1.71 | 1.71 |
| EBIT | 1,265.2 | 2,643.6 | 3,239.6 | 4,230.4 | 4,580.7 | 3,344.4 | 3,463.2 | 3,586.3 | 3,713.8 | 3,845.8 |
| EBIT, % | 3.52 | 6.09 | 8.31 | 10.67 | 11.32 | 7.98 | 7.98 | 7.98 | 7.98 | 7.98 |
| Total Cash | 44.8 | 237.8 | 386.8 | 80.3 | 104.3 | 178.1 | 184.4 | 190.9 | 197.7 | 204.8 |
| Total Cash, percent | .0 | .0 | .0 | .0 | .0 | .0 | .0 | .0 | .0 | .0 |
| Account Receivables | 25,860.3 | 24,911.7 | 18,882.0 | 21,297.8 | 22,175.4 | 23,988.6 | 24,841.3 | 25,724.2 | 26,638.5 | 27,585.3 |
| Account Receivables, % | 71.9 | 57.43 | 48.43 | 53.71 | 54.81 | 57.26 | 57.26 | 57.26 | 57.26 | 57.26 |
| Inventories | 19,753.5 | 20,727.7 | 20,614.1 | 22,559.0 | 23,793.6 | 22,731.6 | 23,539.5 | 24,376.2 | 25,242.6 | 26,139.7 |
| Inventories, % | 54.92 | 47.79 | 52.87 | 56.89 | 58.81 | 54.26 | 54.26 | 54.26 | 54.26 | 54.26 |
| Accounts Payable | 7,417.5 | 5,611.6 | 6,783.1 | 7,596.2 | 7,099.5 | 7,345.5 | 7,606.6 | 7,877.0 | 8,156.9 | 8,446.8 |
| Accounts Payable, % | 20.62 | 12.94 | 17.4 | 19.16 | 17.55 | 17.53 | 17.53 | 17.53 | 17.53 | 17.53 |
| Capital Expenditure | -521.4 | -386.2 | -426.0 | -1,012.0 | -1,810.5 | -876.4 | -907.6 | -939.8 | -973.2 | -1,007.8 |
| Capital Expenditure, % | -1.45 | -0.89027 | -1.09 | -2.55 | -4.47 | -2.09 | -2.09 | -2.09 | -2.09 | -2.09 |
| Tax Rate, % | 27.55 | 27.55 | 27.55 | 27.55 | 27.55 | 27.55 | 27.55 | 27.55 | 27.55 | 27.55 |
| EBITAT | 1,000.7 | 1,704.6 | 1,841.9 | 3,124.0 | 3,318.7 | 2,319.1 | 2,401.6 | 2,486.9 | 2,575.3 | 2,666.9 |
| Depreciation | ||||||||||
| Changes in Account Receivables | ||||||||||
| Changes in Inventories | ||||||||||
| Changes in Accounts Payable | ||||||||||
| Capital Expenditure | ||||||||||
| UFCF | -37,003.1 | 151.4 | 9,371.5 | -797.3 | -387.3 | 1,652.6 | 835.0 | 864.6 | 895.4 | 927.2 |
| WACC, % | 6.92 | 6.83 | 6.78 | 6.89 | 6.88 | 6.86 | 6.86 | 6.86 | 6.86 | 6.86 |
| PV UFCF | ||||||||||
| SUM PV UFCF | 4,338.5 | |||||||||
| Long Term Growth Rate, % | 4.00 | |||||||||
| Free cash flow (T + 1) | 964 | |||||||||
| Terminal Value | 33,735 | |||||||||
| Present Terminal Value | 24,213 | |||||||||
| Enterprise Value | 28,551 | |||||||||
| Net Debt | 2,237 | |||||||||
| Equity Value | 26,314 | |||||||||
| Diluted Shares Outstanding, MM | 42 | |||||||||
| Equity Value Per Share | 631.86 |
Benefits of Choosing BEML Limited (BEMLNS)
- Comprehensive Financial Model: Leverage BEML's real data for accurate DCF valuation.
- Complete Forecasting Flexibility: Modify revenue growth rates, margins, WACC, and other critical factors.
- Real-Time Calculations: Automatic updates allow you to view results instantly as adjustments are made.
- Professional-Grade Template: An advanced Excel file crafted for high-quality valuation presentations.
- Flexible and Reusable: Designed for adaptability, enabling repeated applications for in-depth forecasts.
Key Features
- Pre-Loaded Data: BEML Limited’s historical financial statements and pre-filled forecasts.
- Fully Adjustable Inputs: Modify WACC, tax rates, revenue growth, and EBITDA margins as needed.
- Instant Results: Monitor BEML Limited’s intrinsic value recalculating in real time.
- Clear Visual Outputs: Dashboard charts showcase valuation results and essential metrics.
- Built for Accuracy: A professional-grade tool for analysts, investors, and finance professionals.
How It Functions
- Step 1: Download the prebuilt Excel template featuring BEML Limited's (BEMLNS) data.
- Step 2: Navigate through the pre-filled sheets to familiarize yourself with the essential metrics.
- Step 3: Modify the forecasts and assumptions in the editable yellow cells (WACC, growth, margins).
- Step 4: Instantly see the recalculated results, including BEML Limited's (BEMLNS) intrinsic value.
- Step 5: Make well-informed investment choices or create reports based on the generated outputs.
Why Choose the BEML Limited (BEMLNS) Calculator?
- Precision: Utilizes authentic BEML financial data for reliable calculations.
- Versatility: Enables users to easily test and adjust inputs according to their needs.
- Efficiency: Eliminate the complexity of creating a DCF model from the ground up.
- High-Quality Standards: Crafted with the expertise and accuracy expected at the CFO level.
- Intuitive Design: Simple to navigate, making it accessible for users without extensive financial modeling skills.
Who Can Benefit from BEML Limited (BEMLNS)?
- Investors: Make informed investment choices with a reliable valuation tool tailored for BEML Limited (BEMLNS).
- Financial Analysts: Streamline your analysis process with a customizable DCF model specifically designed for BEML Limited (BEMLNS).
- Consultants: Effortlessly modify the template for client reports or presentations focused on BEML Limited (BEMLNS).
- Finance Enthusiasts: Enhance your knowledge of valuation strategies by exploring real-life applications related to BEML Limited (BEMLNS).
- Educators and Students: Utilize it as a hands-on resource for finance courses centered around BEML Limited (BEMLNS).
Contents of the Template
- Pre-Filled Data: Contains BEML Limited's historical financials and projections.
- Discounted Cash Flow Model: An editable DCF valuation model featuring automatic calculations.
- Weighted Average Cost of Capital (WACC): A specific sheet for calculating WACC based on your custom inputs.
- Key Financial Ratios: Evaluate BEML Limited's profitability, efficiency, and financial leverage.
- Customizable Inputs: Easily adjust revenue growth, margins, and tax rates.
- Clear Dashboard: Visualizations and tables that summarize essential valuation results.
Disclaimer
All information, articles, and product details provided on this website are for general informational and educational purposes only. We do not claim any ownership over, nor do we intend to infringe upon, any trademarks, copyrights, logos, brand names, or other intellectual property mentioned or depicted on this site. Such intellectual property remains the property of its respective owners, and any references here are made solely for identification or informational purposes, without implying any affiliation, endorsement, or partnership.
We make no representations or warranties, express or implied, regarding the accuracy, completeness, or suitability of any content or products presented. Nothing on this website should be construed as legal, tax, investment, financial, medical, or other professional advice. In addition, no part of this site—including articles or product references—constitutes a solicitation, recommendation, endorsement, advertisement, or offer to buy or sell any securities, franchises, or other financial instruments, particularly in jurisdictions where such activity would be unlawful.
All content is of a general nature and may not address the specific circumstances of any individual or entity. It is not a substitute for professional advice or services. Any actions you take based on the information provided here are strictly at your own risk. You accept full responsibility for any decisions or outcomes arising from your use of this website and agree to release us from any liability in connection with your use of, or reliance upon, the content or products found herein.