
|
Bharat Heavy Electricals Limited (BHEL.NS) Valation DCF |
Entièrement Modifiable: Adapté À Vos Besoins Dans Excel Ou Sheets
Conception Professionnelle: Modèles Fiables Et Conformes Aux Normes Du Secteur
Pré-Construits Pour Une Utilisation Rapide Et Efficace
Compatible MAC/PC, entièrement débloqué
Aucune Expertise N'Est Requise; Facile À Suivre
Bharat Heavy Electricals Limited (BHEL.NS) Bundle
Découvrez le véritable potentiel de Bharat Heavy Electricals Limited (BHELNS) avec notre calculatrice avancée DCF! Ajustez les hypothèses clés, explorez divers scénarios et évaluez l'impact des changements sur l'évaluation de Bharat Heavy Electricals Limited - le tout dans un modèle Excel pratique.
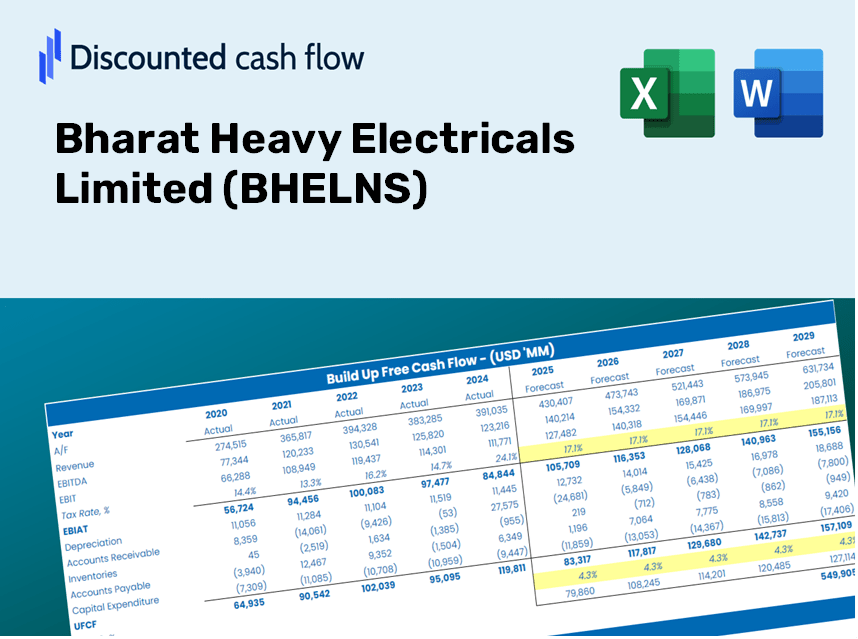
Discounted Cash Flow (DCF) - (USD MM)
| Year | AY1 2021 |
AY2 2022 |
AY3 2023 |
AY4 2024 |
AY5 2025 |
FY1 2026 |
FY2 2027 |
FY3 2028 |
FY4 2029 |
FY5 2030 |
|---|---|---|---|---|---|---|---|---|---|---|
| Revenue | 167,765.0 | 212,110.9 | 228,911.5 | 229,205.2 | 283,394.8 | 324,575.4 | 371,740.0 | 425,758.2 | 487,625.9 | 558,483.7 |
| Revenue Growth, % | 0 | 26.43 | 7.92 | 0.1283 | 23.64 | 14.53 | 14.53 | 14.53 | 14.53 | 14.53 |
| EBITDA | -28,420.0 | 10,262.8 | 13,716.2 | 11,338.4 | 12,415.7 | 2,088.9 | 2,392.4 | 2,740.1 | 3,138.2 | 3,594.3 |
| EBITDA, % | -16.94 | 4.84 | 5.99 | 4.95 | 4.38 | 0.64357 | 0.64357 | 0.64357 | 0.64357 | 0.64357 |
| Depreciation | 4,732.5 | 3,141.2 | 2,603.4 | 2,489.0 | 2,719.6 | 4,858.7 | 5,564.7 | 6,373.4 | 7,299.5 | 8,360.2 |
| Depreciation, % | 2.82 | 1.48 | 1.14 | 1.09 | 0.95965 | 1.5 | 1.5 | 1.5 | 1.5 | 1.5 |
| EBIT | -33,152.5 | 7,121.6 | 11,112.8 | 8,849.4 | 9,696.1 | -2,769.8 | -3,172.3 | -3,633.3 | -4,161.2 | -4,765.9 |
| EBIT, % | -19.76 | 3.36 | 4.85 | 3.86 | 3.42 | -0.85337 | -0.85337 | -0.85337 | -0.85337 | -0.85337 |
| Total Cash | 66,871.9 | 71,437.4 | 69,208.1 | 61,574.7 | 70,572.7 | 100,969.1 | 115,641.1 | 132,445.2 | 151,691.0 | 173,733.5 |
| Total Cash, percent | .0 | .0 | .0 | .0 | .0 | .0 | .0 | .0 | .0 | .0 |
| Account Receivables | 132,659.4 | 117,163.8 | 148,720.4 | 204,741.3 | 228,184.3 | 239,617.7 | 274,437.0 | 314,315.9 | 359,989.7 | 412,300.5 |
| Account Receivables, % | 79.07 | 55.24 | 64.97 | 89.33 | 80.52 | 73.82 | 73.82 | 73.82 | 73.82 | 73.82 |
| Inventories | 71,944.5 | 65,602.1 | 67,559.0 | 72,205.7 | 98,694.9 | 110,131.1 | 126,134.4 | 144,463.2 | 165,455.4 | 189,498.0 |
| Inventories, % | 42.88 | 30.93 | 29.51 | 31.5 | 34.83 | 33.93 | 33.93 | 33.93 | 33.93 | 33.93 |
| Accounts Payable | 66,825.7 | 77,495.9 | 98,958.3 | 86,962.4 | 95,409.2 | 124,121.4 | 142,157.7 | 162,814.9 | 186,473.8 | 213,570.6 |
| Accounts Payable, % | 39.83 | 36.54 | 43.23 | 37.94 | 33.67 | 38.24 | 38.24 | 38.24 | 38.24 | 38.24 |
| Capital Expenditure | -2,503.5 | -1,693.8 | -1,884.0 | -2,325.0 | -2,815.4 | -3,324.7 | -3,807.9 | -4,361.2 | -4,994.9 | -5,720.7 |
| Capital Expenditure, % | -1.49 | -0.79854 | -0.82303 | -1.01 | -0.99346 | -1.02 | -1.02 | -1.02 | -1.02 | -1.02 |
| Tax Rate, % | 28.39 | 28.39 | 28.39 | 28.39 | 28.39 | 28.39 | 28.39 | 28.39 | 28.39 | 28.39 |
| EBITAT | -24,865.9 | 6,751.8 | 10,157.9 | 10,292.1 | 6,943.1 | -2,397.7 | -2,746.1 | -3,145.2 | -3,602.2 | -4,125.6 |
| Depreciation | ||||||||||
| Changes in Account Receivables | ||||||||||
| Changes in Inventories | ||||||||||
| Changes in Accounts Payable | ||||||||||
| Capital Expenditure | ||||||||||
| UFCF | -160,415.1 | 40,707.4 | -1,173.8 | -62,207.4 | -34,638.1 | 4,978.9 | -33,775.6 | -38,683.5 | -44,304.7 | -50,742.7 |
| WACC, % | 7.14 | 7.3 | 7.27 | 7.34 | 7.12 | 7.24 | 7.24 | 7.24 | 7.24 | 7.24 |
| PV UFCF | ||||||||||
| SUM PV UFCF | -125,383.9 | |||||||||
| Long Term Growth Rate, % | 4.00 | |||||||||
| Free cash flow (T + 1) | -52,772 | |||||||||
| Terminal Value | -1,630,856 | |||||||||
| Present Terminal Value | -1,150,046 | |||||||||
| Enterprise Value | -1,275,430 | |||||||||
| Net Debt | 14,022 | |||||||||
| Equity Value | -1,289,452 | |||||||||
| Diluted Shares Outstanding, MM | 3,490 | |||||||||
| Equity Value Per Share | -369.52 |
What You Will Receive
- Comprehensive Financial Model: Utilize BHELNS's actual data for accurate DCF valuation.
- Full Forecast Control: Modify revenue growth, margins, WACC, and other essential drivers.
- Real-Time Calculations: Instant updates allow you to view changes as you make adjustments.
- Professional-Grade Template: A polished Excel file tailored for high-quality valuation.
- Adaptable and Reusable: Designed for versatility, enabling multiple uses for in-depth forecasts.
Key Features
- 🔍 Real-Life BHEL Financials: Pre-filled historical and projected data for Bharat Heavy Electricals Limited (BHELNS).
- ✏️ Fully Customizable Inputs: Adjust all critical parameters (yellow cells) such as WACC, growth %, and tax rates.
- 📊 Professional DCF Valuation: Integrated formulas compute BHEL's intrinsic value using the Discounted Cash Flow method.
- ⚡ Instant Results: Visualize BHEL's valuation in real-time after applying changes.
- Scenario Analysis: Assess and compare different outcomes based on various financial assumptions side-by-side.
How It Functions
- 1. Access the Template: Download and open the Excel file containing BHEL’s preloaded data.
- 2. Modify Assumptions: Adjust essential inputs such as growth rates, WACC, and capital expenditures.
- 3. Instantly View Results: The DCF model automatically calculates the intrinsic value and NPV.
- 4. Explore Scenarios: Analyze various forecasts to evaluate different valuation outcomes.
- 5. Present with Assurance: Share professional valuation insights to back up your decision-making.
Why Choose the BHEL Calculator?
- Time-Efficient: Skip the hassle of building a DCF model from the ground up – it’s pre-configured for your use.
- Enhanced Accuracy: Dependable financial data and established formulas minimize valuation errors.
- Completely Customizable: Customize the model to align with your specific assumptions and forecasts.
- User-Friendly: Intuitive charts and outputs simplify the process of result analysis.
- Endorsed by Professionals: Crafted for experts who prioritize precision and functionality.
Who Should Use This Product?
- Finance Students: Master valuation techniques and practice them with real-world data.
- Academics: Integrate professional valuation models into your research or teaching materials.
- Investors: Challenge your assumptions and evaluate the valuation results for Bharat Heavy Electricals Limited (BHELNS).
- Analysts: Enhance your efficiency with a customizable, ready-to-use DCF model.
- Small Business Owners: Understand how major public firms like Bharat Heavy Electricals Limited (BHELNS) are analyzed.
Contents of the Template
- Operating and Balance Sheet Data: Pre-filled historical data and forecasts for Bharat Heavy Electricals Limited (BHELNS), including revenue, EBITDA, EBIT, and capital expenditures.
- WACC Calculation: A dedicated sheet for calculating the Weighted Average Cost of Capital (WACC), featuring parameters such as Beta, risk-free rate, and share price.
- DCF Valuation (Unlevered and Levered): Editable Discounted Cash Flow models that display intrinsic value with comprehensive calculations.
- Financial Statements: Pre-loaded annual and quarterly financial statements to facilitate analysis.
- Key Ratios: Provides profitability, leverage, and efficiency ratios specific to Bharat Heavy Electricals Limited (BHELNS).
- Dashboard and Charts: A visual summary of valuation outputs and assumptions for easy result analysis.
Disclaimer
All information, articles, and product details provided on this website are for general informational and educational purposes only. We do not claim any ownership over, nor do we intend to infringe upon, any trademarks, copyrights, logos, brand names, or other intellectual property mentioned or depicted on this site. Such intellectual property remains the property of its respective owners, and any references here are made solely for identification or informational purposes, without implying any affiliation, endorsement, or partnership.
We make no representations or warranties, express or implied, regarding the accuracy, completeness, or suitability of any content or products presented. Nothing on this website should be construed as legal, tax, investment, financial, medical, or other professional advice. In addition, no part of this site—including articles or product references—constitutes a solicitation, recommendation, endorsement, advertisement, or offer to buy or sell any securities, franchises, or other financial instruments, particularly in jurisdictions where such activity would be unlawful.
All content is of a general nature and may not address the specific circumstances of any individual or entity. It is not a substitute for professional advice or services. Any actions you take based on the information provided here are strictly at your own risk. You accept full responsibility for any decisions or outcomes arising from your use of this website and agree to release us from any liability in connection with your use of, or reliance upon, the content or products found herein.