
|
Benson Hill, Inc. (BHIL) Évaluation DCF |
Entièrement Modifiable: Adapté À Vos Besoins Dans Excel Ou Sheets
Conception Professionnelle: Modèles Fiables Et Conformes Aux Normes Du Secteur
Pré-Construits Pour Une Utilisation Rapide Et Efficace
Compatible MAC/PC, entièrement débloqué
Aucune Expertise N'Est Requise; Facile À Suivre
Benson Hill, Inc. (BHIL) Bundle
Améliorez vos choix d'investissement avec la calculatrice DCF de Benson Hill, Inc. (BHIL)! Passez en revue les données financières authentiques pour Benson Hill, ajustez vos projections et dépenses de croissance et observez instantanément comment ces modifications affectent la valeur intrinsèque de Benson Hill, Inc. (BHIL).
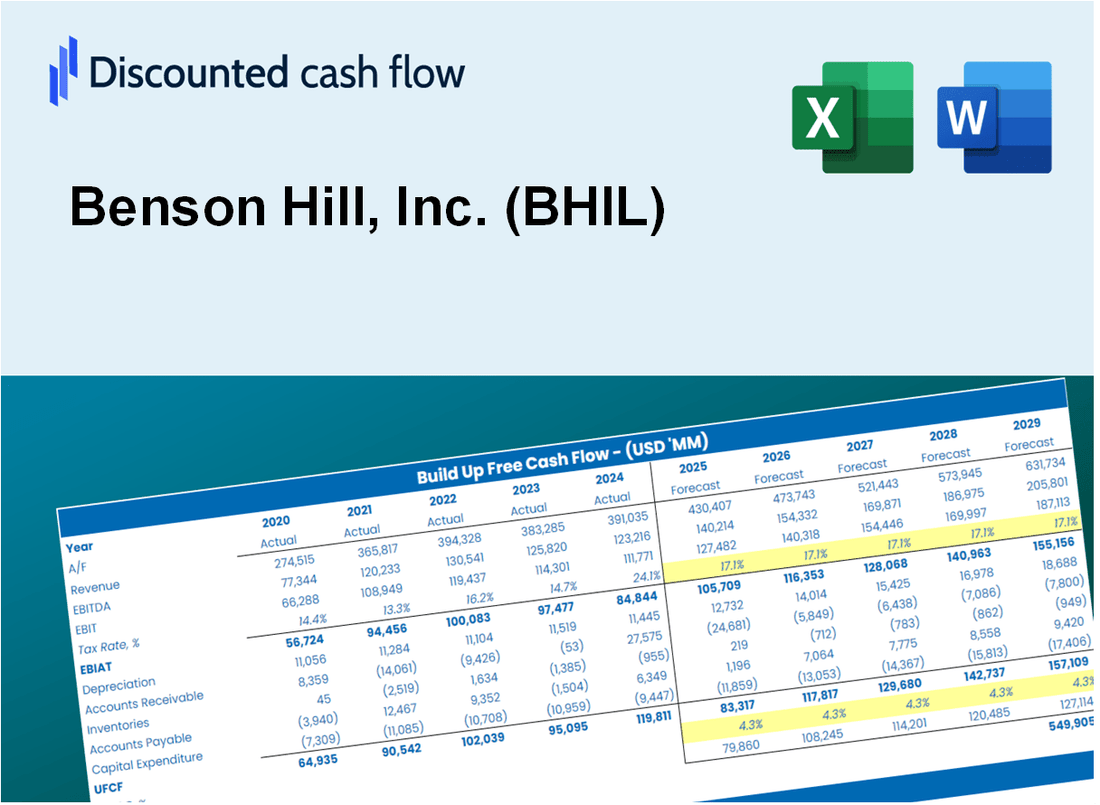
Discounted Cash Flow (DCF) - (USD MM)
| Year | AY1 2019 |
AY2 2020 |
AY3 2021 |
AY4 2022 |
AY5 2023 |
FY1 2024 |
FY2 2025 |
FY3 2026 |
FY4 2027 |
FY5 2028 |
|---|---|---|---|---|---|---|---|---|---|---|
| Revenue | 79.5 | 59.1 | 147.2 | 381.2 | 473.3 | 708.2 | 1,059.5 | 1,585.1 | 2,371.4 | 3,547.9 |
| Revenue Growth, % | 0 | -25.72 | 149.22 | 158.97 | 24.16 | 49.61 | 49.61 | 49.61 | 49.61 | 49.61 |
| EBITDA | -39.9 | -46.8 | -109.1 | -55.4 | -54.3 | -325.0 | -486.3 | -727.6 | -1,088.5 | -1,628.5 |
| EBITDA, % | -50.18 | -79.23 | -74.11 | -14.52 | -11.47 | -45.9 | -45.9 | -45.9 | -45.9 | -45.9 |
| Depreciation | 3.8 | 7.6 | 10.5 | 22.2 | 21.6 | 49.7 | 74.3 | 111.2 | 166.3 | 248.8 |
| Depreciation, % | 4.77 | 12.78 | 7.13 | 5.82 | 4.57 | 7.01 | 7.01 | 7.01 | 7.01 | 7.01 |
| EBIT | -43.7 | -54.3 | -119.6 | -77.6 | -75.9 | -374.7 | -560.6 | -838.7 | -1,254.8 | -1,877.3 |
| EBIT, % | -54.95 | -92.01 | -81.24 | -20.34 | -16.03 | -52.91 | -52.91 | -52.91 | -52.91 | -52.91 |
| Total Cash | 10.9 | 110.1 | 182.7 | 157.2 | 48.7 | 375.7 | 562.1 | 840.9 | 1,258.1 | 1,882.2 |
| Total Cash, percent | .0 | .0 | .0 | .0 | .0 | .0 | .0 | .0 | .0 | .0 |
| Account Receivables | 15.1 | 14.8 | 26.3 | 29.2 | 37.6 | 109.7 | 164.2 | 245.6 | 367.4 | 549.7 |
| Account Receivables, % | 18.98 | 25.01 | 17.86 | 7.66 | 7.95 | 15.49 | 15.49 | 15.49 | 15.49 | 15.49 |
| Inventories | 7.2 | 13.0 | 48.7 | 62.1 | 25.5 | 121.6 | 181.9 | 272.2 | 407.3 | 609.3 |
| Inventories, % | 9.02 | 22.08 | 33.1 | 16.29 | 5.39 | 17.17 | 17.17 | 17.17 | 17.17 | 17.17 |
| Accounts Payable | 17.1 | 16.1 | 20.3 | 36.7 | 17.1 | 107.4 | 160.6 | 240.3 | 359.5 | 537.9 |
| Accounts Payable, % | 21.47 | 27.3 | 13.78 | 9.63 | 3.62 | 15.16 | 15.16 | 15.16 | 15.16 | 15.16 |
| Capital Expenditure | -6.8 | -9.9 | -31.5 | -16.5 | -11.8 | -75.8 | -113.3 | -169.6 | -253.7 | -379.5 |
| Capital Expenditure, % | -8.6 | -16.68 | -21.39 | -4.32 | -2.48 | -10.7 | -10.7 | -10.7 | -10.7 | -10.7 |
| Tax Rate, % | -3.48 | -3.48 | -3.48 | -3.48 | -3.48 | -3.48 | -3.48 | -3.48 | -3.48 | -3.48 |
| EBITAT | -43.7 | -54.4 | -119.8 | -99.5 | -78.5 | -374.7 | -560.6 | -838.7 | -1,254.8 | -1,877.3 |
| Depreciation | ||||||||||
| Changes in Account Receivables | ||||||||||
| Changes in Inventories | ||||||||||
| Changes in Accounts Payable | ||||||||||
| Capital Expenditure | ||||||||||
| UFCF | -52.0 | -63.2 | -183.8 | -93.7 | -60.1 | -478.8 | -661.1 | -989.1 | -1,479.8 | -2,214.0 |
| WACC, % | 23.96 | 23.96 | 23.96 | 23.96 | 23.96 | 23.96 | 23.96 | 23.96 | 23.96 | 23.96 |
| PV UFCF | ||||||||||
| SUM PV UFCF | -2,719.1 | |||||||||
| Long Term Growth Rate, % | 2.00 | |||||||||
| Free cash flow (T + 1) | -2,258 | |||||||||
| Terminal Value | -10,284 | |||||||||
| Present Terminal Value | -3,514 | |||||||||
| Enterprise Value | -6,233 | |||||||||
| Net Debt | 130 | |||||||||
| Equity Value | -6,363 | |||||||||
| Diluted Shares Outstanding, MM | 5 | |||||||||
| Equity Value Per Share | -1,185.06 |
What You Will Get
- Real Benson Hill Data: Preloaded financials – from revenue to EBIT – based on actual and projected figures for Benson Hill, Inc. (BHIL).
- Full Customization: Adjust all critical parameters (yellow cells) like WACC, growth %, and tax rates specific to Benson Hill, Inc. (BHIL).
- Instant Valuation Updates: Automatic recalculations to analyze the impact of changes on Benson Hill, Inc.'s (BHIL) fair value.
- Versatile Excel Template: Tailored for quick edits, scenario testing, and detailed projections for Benson Hill, Inc. (BHIL).
- Time-Saving and Accurate: Skip building models from scratch while maintaining precision and flexibility for Benson Hill, Inc. (BHIL).
Key Features
- 🔍 Real-Life BHIL Financials: Pre-filled historical and projected data for Benson Hill, Inc.
- ✏️ Fully Customizable Inputs: Adjust all critical parameters (yellow cells) like WACC, growth %, and tax rates.
- 📊 Professional DCF Valuation: Built-in formulas calculate Benson Hill’s intrinsic value using the Discounted Cash Flow method.
- ⚡ Instant Results: Visualize Benson Hill’s valuation instantly after making changes.
- Scenario Analysis: Test and compare outcomes for various financial assumptions side-by-side.
How It Works
- Download: Obtain the ready-to-use Excel file featuring Benson Hill, Inc.'s (BHIL) financial data.
- Customize: Tailor forecasts, including revenue growth, EBITDA %, and WACC to your needs.
- Update Automatically: Watch as intrinsic value and NPV calculations refresh in real-time.
- Test Scenarios: Develop various projections and instantly compare results.
- Make Decisions: Leverage the valuation outcomes to inform your investment strategy.
Why Choose This Calculator for Benson Hill, Inc. (BHIL)?
- User-Friendly Interface: Tailored for both novice users and seasoned professionals.
- Customizable Inputs: Adjust parameters easily to suit your analytical needs.
- Real-Time Feedback: Observe immediate updates to Benson Hill’s valuation as you modify inputs.
- Preloaded Data: Comes with Benson Hill’s latest financial information for swift evaluations.
- Relied Upon by Experts: Favored by investors and analysts for making educated choices.
Who Should Use Benson Hill, Inc. (BHIL)?
- Investors: Make informed investment choices with insights from a leading agricultural technology company.
- Financial Analysts: Streamline your analysis with comprehensive data on sustainable food production.
- Consultants: Easily modify reports and presentations to showcase innovative solutions in agriculture.
- Agri-Tech Enthusiasts: Expand your knowledge of cutting-edge agricultural practices and technologies.
- Educators and Students: Utilize real-world case studies for hands-on learning in agribusiness and sustainability courses.
What the Template Contains
- Preloaded BHIL Data: Historical and projected financial data, including revenue, EBIT, and capital expenditures.
- DCF and WACC Models: Professional-grade sheets for calculating intrinsic value and Weighted Average Cost of Capital.
- Editable Inputs: Yellow-highlighted cells for adjusting revenue growth, tax rates, and discount rates.
- Financial Statements: Comprehensive annual and quarterly financials for deeper analysis.
- Key Ratios: Profitability, leverage, and efficiency ratios to evaluate performance.
- Dashboard and Charts: Visual summaries of valuation outcomes and assumptions.
Disclaimer
All information, articles, and product details provided on this website are for general informational and educational purposes only. We do not claim any ownership over, nor do we intend to infringe upon, any trademarks, copyrights, logos, brand names, or other intellectual property mentioned or depicted on this site. Such intellectual property remains the property of its respective owners, and any references here are made solely for identification or informational purposes, without implying any affiliation, endorsement, or partnership.
We make no representations or warranties, express or implied, regarding the accuracy, completeness, or suitability of any content or products presented. Nothing on this website should be construed as legal, tax, investment, financial, medical, or other professional advice. In addition, no part of this site—including articles or product references—constitutes a solicitation, recommendation, endorsement, advertisement, or offer to buy or sell any securities, franchises, or other financial instruments, particularly in jurisdictions where such activity would be unlawful.
All content is of a general nature and may not address the specific circumstances of any individual or entity. It is not a substitute for professional advice or services. Any actions you take based on the information provided here are strictly at your own risk. You accept full responsibility for any decisions or outcomes arising from your use of this website and agree to release us from any liability in connection with your use of, or reliance upon, the content or products found herein.