
|
BHP Group Limited (BHP) Évaluation DCF |
Entièrement Modifiable: Adapté À Vos Besoins Dans Excel Ou Sheets
Conception Professionnelle: Modèles Fiables Et Conformes Aux Normes Du Secteur
Pré-Construits Pour Une Utilisation Rapide Et Efficace
Compatible MAC/PC, entièrement débloqué
Aucune Expertise N'Est Requise; Facile À Suivre
BHP Group Limited (BHP) Bundle
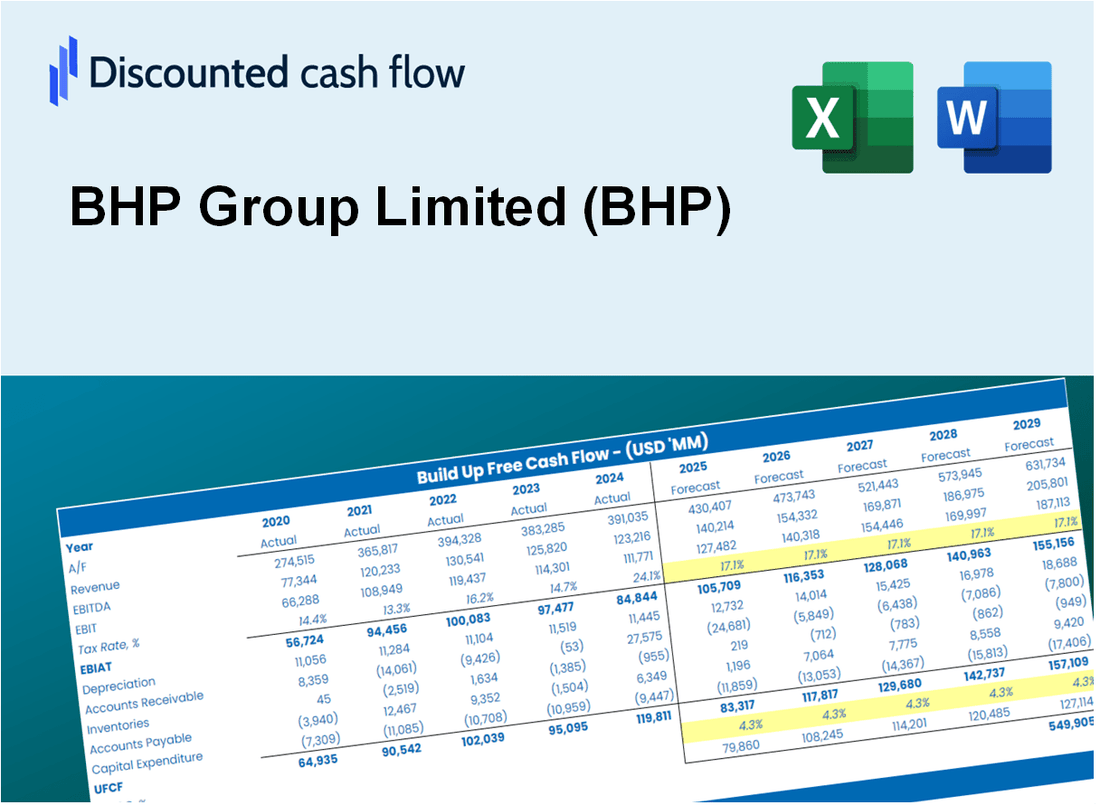
Que vous soyez un investisseur ou un analyste, cette calculatrice DCF (BHP) est votre outil essentiel pour une évaluation précise. Préchargé avec des données réelles de BHP Group Limited, vous pouvez ajuster les prévisions et observer instantanément les effets.
What You Will Receive
- Customizable Excel Template: A fully adjustable Excel-based DCF Calculator featuring pre-filled real BHP financials.
- Real-World Data: Access to historical data and forward-looking estimates (highlighted in the yellow cells).
- Flexible Forecasting: Modify forecast assumptions such as revenue growth, EBITDA %, and WACC.
- Instant Calculations: Quickly observe the effects of your inputs on BHP’s valuation.
- Professional Resource: Designed for investors, CFOs, consultants, and financial analysts.
- User-Friendly Interface: Organized for clarity and simplicity, complete with step-by-step guidance.
Key Features
- Comprehensive Historical Data: BHP’s past financial statements and pre-populated projections.
- Customizable Parameters: Modify WACC, tax rates, revenue growth, and EBITDA margins as needed.
- Real-Time Insights: Observe BHP’s intrinsic value being recalculated instantly.
- Intuitive Visualizations: Dashboard graphs present valuation outcomes and essential metrics clearly.
- Engineered for Precision: A reliable tool designed for analysts, investors, and finance professionals.
How It Works
- Step 1: Download the Excel file.
- Step 2: Review pre-entered BHP data (historical and projected).
- Step 3: Adjust key assumptions (yellow cells) based on your analysis.
- Step 4: View automatic recalculations for BHP’s intrinsic value.
- Step 5: Use the outputs for investment decisions or reporting.
Why Choose This Calculator for BHP Group Limited (BHP)?
- Accuracy: Utilizes real BHP financial data to ensure precision.
- Flexibility: Allows users to easily test and adjust inputs as needed.
- Time-Saving: Avoid the complexities of creating a DCF model from the ground up.
- Professional-Grade: Crafted with the expertise and usability expected at the CFO level.
- User-Friendly: Simple to navigate, even for those without extensive financial modeling skills.
Who Should Use This Product?
- Finance Students: Master valuation techniques and apply them using real-time data from BHP Group Limited (BHP).
- Academics: Integrate industry-standard models into your coursework or research focused on BHP Group Limited (BHP).
- Investors: Validate your investment strategies and evaluate valuation metrics for BHP Group Limited (BHP).
- Analysts: Enhance your analysis process with a customizable DCF model tailored for BHP Group Limited (BHP).
- Small Business Owners: Understand the valuation approaches used for large corporations like BHP Group Limited (BHP).
What the Template Contains
- Pre-Filled DCF Model: BHP Group Limited’s (BHP) financial data preloaded for immediate use.
- WACC Calculator: Detailed calculations for Weighted Average Cost of Capital.
- Financial Ratios: Evaluate BHP’s profitability, leverage, and efficiency.
- Editable Inputs: Change assumptions such as growth, margins, and CAPEX to fit your scenarios.
- Financial Statements: Annual and quarterly reports to support detailed analysis.
- Interactive Dashboard: Easily visualize key valuation metrics and results.
Disclaimer
All information, articles, and product details provided on this website are for general informational and educational purposes only. We do not claim any ownership over, nor do we intend to infringe upon, any trademarks, copyrights, logos, brand names, or other intellectual property mentioned or depicted on this site. Such intellectual property remains the property of its respective owners, and any references here are made solely for identification or informational purposes, without implying any affiliation, endorsement, or partnership.
We make no representations or warranties, express or implied, regarding the accuracy, completeness, or suitability of any content or products presented. Nothing on this website should be construed as legal, tax, investment, financial, medical, or other professional advice. In addition, no part of this site—including articles or product references—constitutes a solicitation, recommendation, endorsement, advertisement, or offer to buy or sell any securities, franchises, or other financial instruments, particularly in jurisdictions where such activity would be unlawful.
All content is of a general nature and may not address the specific circumstances of any individual or entity. It is not a substitute for professional advice or services. Any actions you take based on the information provided here are strictly at your own risk. You accept full responsibility for any decisions or outcomes arising from your use of this website and agree to release us from any liability in connection with your use of, or reliance upon, the content or products found herein.