
|
Brookfield Infrastructure Partners L.P. (BIP) Évaluation DCF |
Entièrement Modifiable: Adapté À Vos Besoins Dans Excel Ou Sheets
Conception Professionnelle: Modèles Fiables Et Conformes Aux Normes Du Secteur
Pré-Construits Pour Une Utilisation Rapide Et Efficace
Compatible MAC/PC, entièrement débloqué
Aucune Expertise N'Est Requise; Facile À Suivre
Brookfield Infrastructure Partners L.P. (BIP) Bundle
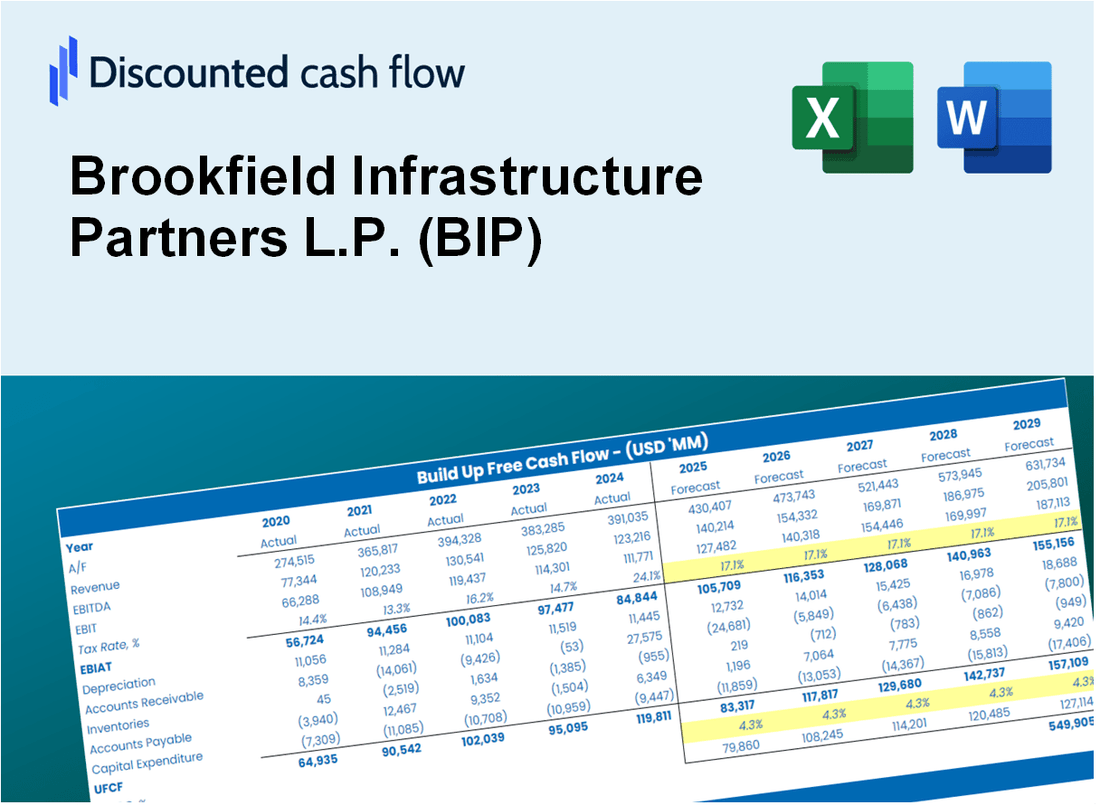
Conçu pour la précision, notre calculatrice (BIP) DCF vous permet d'évaluer l'évaluation des partenaires d'infrastructure de Brookfield L.P. à l'aide de données financières du monde réel, tout en offrant la flexibilité pour modifier tous les paramètres clés pour des projections améliorées.
What You Will Receive
- Authentic BIP Financial Data: Pre-filled with Brookfield Infrastructure’s historical and forecasted data for in-depth analysis.
- Customizable Template: Easily adjust essential inputs such as revenue growth, WACC, and EBITDA %.
- Instant Calculations: Watch Brookfield Infrastructure’s intrinsic value refresh automatically as you make changes.
- Expert Valuation Tool: Tailored for investors, analysts, and consultants aiming for precise DCF outcomes.
- Intuitive Design: Straightforward layout and clear guidance suitable for all skill levels.
Key Features
- 🔍 Real-Life BIP Financials: Pre-filled historical and projected data for Brookfield Infrastructure Partners L.P. (BIP).
- ✏️ Fully Customizable Inputs: Adjust all critical parameters (yellow cells) like WACC, growth %, and tax rates.
- 📊 Professional DCF Valuation: Built-in formulas calculate Brookfield’s intrinsic value using the Discounted Cash Flow method.
- ⚡ Instant Results: Visualize Brookfield’s valuation instantly after making changes.
- Scenario Analysis: Test and compare outcomes for various financial assumptions side-by-side.
How It Works
- Step 1: Download the Excel file.
- Step 2: Review pre-entered Brookfield Infrastructure data (historical and projected).
- Step 3: Adjust key assumptions (yellow cells) based on your analysis.
- Step 4: View automatic recalculations for Brookfield Infrastructure's intrinsic value.
- Step 5: Use the outputs for investment decisions or reporting.
Why Choose This Calculator for Brookfield Infrastructure Partners L.P. (BIP)?
- Accurate Data: Access to up-to-date Brookfield Infrastructure financials for dependable valuation outcomes.
- Customizable: Tailor essential inputs like growth projections, WACC, and tax rates to fit your analysis.
- Time-Saving: Pre-configured calculations streamline your workflow, saving you time.
- Professional-Grade Tool: Ideal for investors, analysts, and financial consultants in the infrastructure sector.
- User-Friendly: Designed with an intuitive interface and clear instructions for users of all experience levels.
Who Should Use This Product?
- Investors: Evaluate Brookfield Infrastructure Partners L.P. (BIP) for informed investment decisions.
- CFOs and Financial Analysts: Enhance valuation methodologies and assess financial forecasts.
- Startup Founders: Understand the valuation metrics applied to large infrastructure firms like Brookfield.
- Consultants: Provide comprehensive valuation analyses and reports for clients in the infrastructure sector.
- Students and Educators: Utilize current market data to explore and teach infrastructure valuation principles.
What the Template Contains
- Preloaded BIP Data: Historical and projected financial data, including revenue, EBITDA, and capital expenditures.
- DCF and WACC Models: Professional-grade sheets for calculating intrinsic value and Weighted Average Cost of Capital.
- Editable Inputs: Yellow-highlighted cells for adjusting revenue growth, tax rates, and discount rates.
- Financial Statements: Comprehensive annual and quarterly financials for deeper analysis.
- Key Ratios: Profitability, leverage, and efficiency ratios to evaluate performance.
- Dashboard and Charts: Visual summaries of valuation outcomes and assumptions.
Disclaimer
All information, articles, and product details provided on this website are for general informational and educational purposes only. We do not claim any ownership over, nor do we intend to infringe upon, any trademarks, copyrights, logos, brand names, or other intellectual property mentioned or depicted on this site. Such intellectual property remains the property of its respective owners, and any references here are made solely for identification or informational purposes, without implying any affiliation, endorsement, or partnership.
We make no representations or warranties, express or implied, regarding the accuracy, completeness, or suitability of any content or products presented. Nothing on this website should be construed as legal, tax, investment, financial, medical, or other professional advice. In addition, no part of this site—including articles or product references—constitutes a solicitation, recommendation, endorsement, advertisement, or offer to buy or sell any securities, franchises, or other financial instruments, particularly in jurisdictions where such activity would be unlawful.
All content is of a general nature and may not address the specific circumstances of any individual or entity. It is not a substitute for professional advice or services. Any actions you take based on the information provided here are strictly at your own risk. You accept full responsibility for any decisions or outcomes arising from your use of this website and agree to release us from any liability in connection with your use of, or reliance upon, the content or products found herein.