
|
Bitfarms Ltd. (Bitf) Valation DCF |
Entièrement Modifiable: Adapté À Vos Besoins Dans Excel Ou Sheets
Conception Professionnelle: Modèles Fiables Et Conformes Aux Normes Du Secteur
Pré-Construits Pour Une Utilisation Rapide Et Efficace
Compatible MAC/PC, entièrement débloqué
Aucune Expertise N'Est Requise; Facile À Suivre
Bitfarms Ltd. (BITF) Bundle
En tant qu'investisseur ou analyste, cette calculatrice DCF pour BitFarms Ltd. (BITF) est votre ressource incontournable pour une évaluation précise. Chargé de données réelles de BitFarms, vous pouvez ajuster les prévisions et observer les effets en temps réel.
What You Will Receive
- Flexible Input Variables: Modify key parameters (growth %, margins, WACC) effortlessly to generate various scenarios.
- Industry-Specific Data: Bitfarms Ltd.’s (BITF) financial data pre-loaded to enhance your analysis.
- Automated DCF Calculations: The template computes Net Present Value (NPV) and intrinsic value automatically for you.
- Professional and Adaptable: A sleek Excel model that caters to your valuation requirements.
- Designed for Analysts and Investors: Perfect for evaluating forecasts, affirming strategies, and maximizing efficiency.
Key Features
- Customizable Mining Parameters: Adjust essential inputs such as hash rate, energy costs, and equipment efficiency.
- Instant Mining Profitability Analysis: Quickly assesses profitability metrics and break-even points.
- High-Precision Projections: Leverages Bitfarms Ltd.'s (BITF) actual operational data for accurate financial insights.
- Seamless Scenario Comparisons: Evaluate various market conditions and their impacts on profitability effortlessly.
- Efficiency Booster: Streamlines the analysis process, removing the need for complex financial models.
How It Works
- Step 1: Download the Excel spreadsheet.
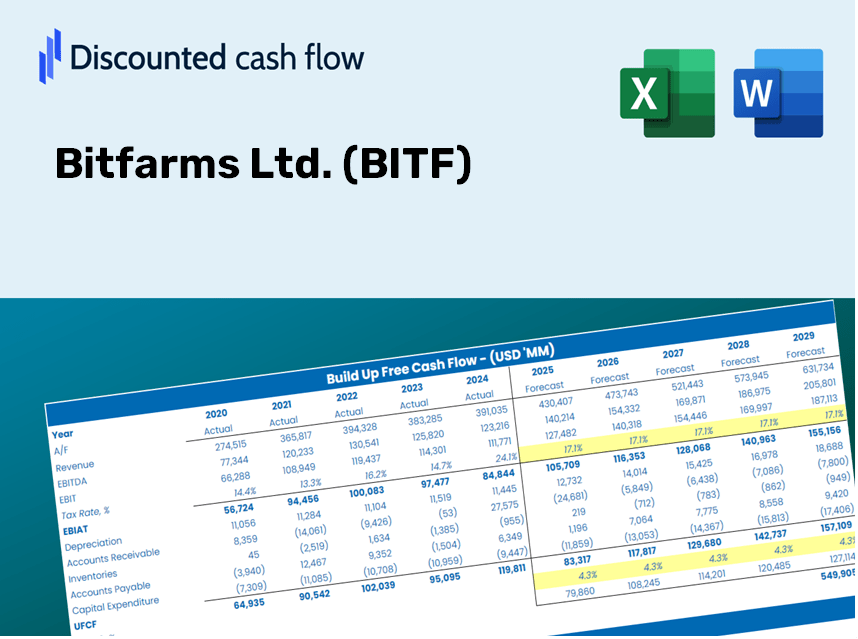
- Step 2: Examine the pre-filled Bitfarms Ltd. (BITF) data, both historical and forecasted.
- Step 3: Modify the key assumptions (highlighted in yellow) according to your analysis.
- Step 4: Observe the automatic updates reflecting Bitfarms Ltd. (BITF)’s intrinsic value.
- Step 5: Utilize the results for investment choices or reporting purposes.
Why Opt for This Bitfarms Ltd. (BITF) Calculator?
- Precise Financial Insights: Utilize real Bitfarms financials for trustworthy valuation results.
- Tailorable Features: Modify essential variables like growth projections, WACC, and tax rates to align with your forecasts.
- Efficiency Boost: Pre-configured calculations save you the hassle of starting from scratch.
- Professional-Quality Resource: Crafted for investors, analysts, and consultants in the field.
- Easy to Navigate: User-friendly design and clear, step-by-step guidance ensure accessibility for everyone.
Who Should Use This Product?
- Investors: Assess Bitfarms Ltd.'s (BITF) valuation prior to making investment decisions.
- CFOs and Financial Analysts: Optimize valuation methodologies and evaluate financial forecasts for Bitfarms Ltd. (BITF).
- Startup Founders: Discover how leading public companies, such as Bitfarms Ltd. (BITF), are valued.
- Consultants: Create comprehensive valuation reports for clients focusing on Bitfarms Ltd. (BITF).
- Students and Educators: Utilize real-time data from Bitfarms Ltd. (BITF) to practice and teach valuation strategies.
What the Template Contains
- Historical Data: Contains Bitfarms Ltd.’s past financial information and baseline forecasts.
- DCF and Levered DCF Models: Comprehensive templates designed to compute Bitfarms Ltd.’s intrinsic value.
- WACC Sheet: Pre-configured calculations for Weighted Average Cost of Capital.
- Editable Inputs: Customize key drivers such as growth rates, EBITDA %, and CAPEX assumptions.
- Quarterly and Annual Statements: An exhaustive breakdown of Bitfarms Ltd.’s financials.
- Interactive Dashboard: Dynamically visualize valuation outcomes and future projections.
Disclaimer
All information, articles, and product details provided on this website are for general informational and educational purposes only. We do not claim any ownership over, nor do we intend to infringe upon, any trademarks, copyrights, logos, brand names, or other intellectual property mentioned or depicted on this site. Such intellectual property remains the property of its respective owners, and any references here are made solely for identification or informational purposes, without implying any affiliation, endorsement, or partnership.
We make no representations or warranties, express or implied, regarding the accuracy, completeness, or suitability of any content or products presented. Nothing on this website should be construed as legal, tax, investment, financial, medical, or other professional advice. In addition, no part of this site—including articles or product references—constitutes a solicitation, recommendation, endorsement, advertisement, or offer to buy or sell any securities, franchises, or other financial instruments, particularly in jurisdictions where such activity would be unlawful.
All content is of a general nature and may not address the specific circumstances of any individual or entity. It is not a substitute for professional advice or services. Any actions you take based on the information provided here are strictly at your own risk. You accept full responsibility for any decisions or outcomes arising from your use of this website and agree to release us from any liability in connection with your use of, or reliance upon, the content or products found herein.