
|
Baker Hughes Company (BKR) Évaluation DCF |
Entièrement Modifiable: Adapté À Vos Besoins Dans Excel Ou Sheets
Conception Professionnelle: Modèles Fiables Et Conformes Aux Normes Du Secteur
Pré-Construits Pour Une Utilisation Rapide Et Efficace
Compatible MAC/PC, entièrement débloqué
Aucune Expertise N'Est Requise; Facile À Suivre
Baker Hughes Company (BKR) Bundle
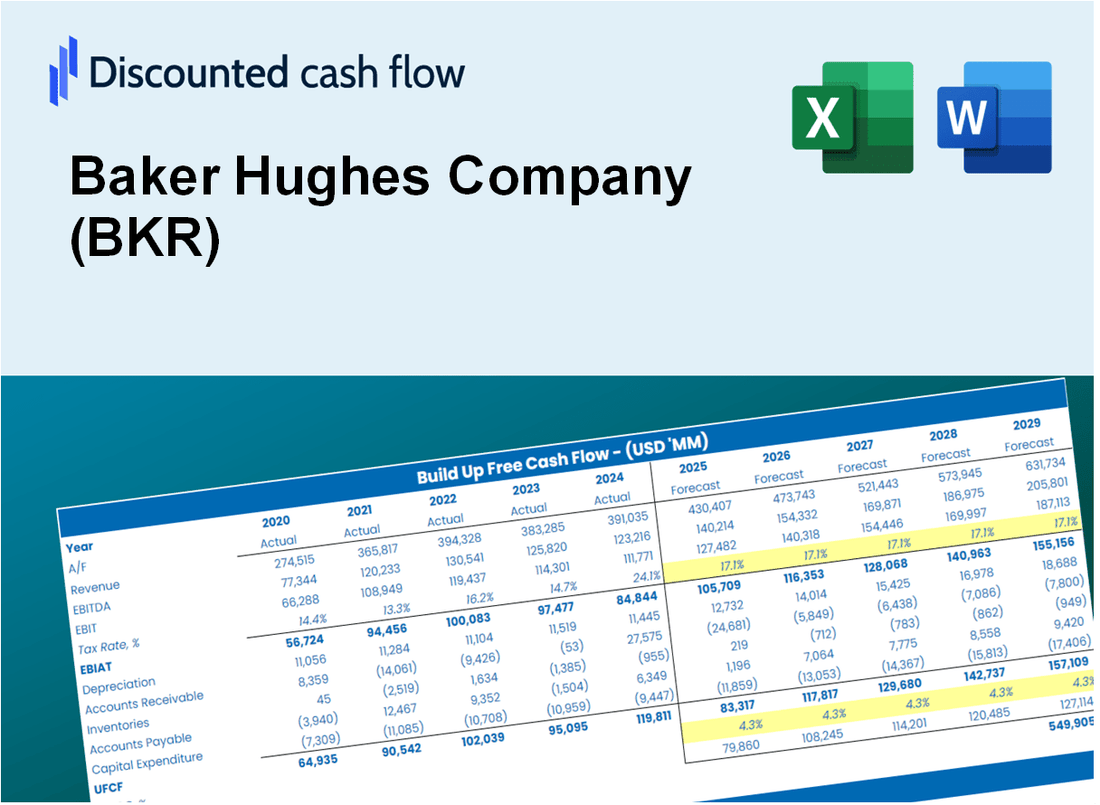
Simplifiez l'évaluation Baker Hughes Company (BKR) avec cette calculatrice DCF personnalisable! Doté de la vraie valeur des finances Baker Hughes Company (BKR) et des prévisions ajustées, vous pouvez tester les scénarios et découvrir la juste valeur de Baker Hughes Company (BKR) en minutes.
What You Will Receive
- Comprehensive Financial Model: Leveraging Baker Hughes’ actual data for accurate DCF valuation.
- Complete Forecast Control: Modify revenue growth, profit margins, WACC, and other essential factors.
- Real-Time Calculations: Instant updates provide immediate insights as you adjust parameters.
- Professional-Grade Template: A polished Excel file crafted for high-quality valuation presentations.
- Flexible and Reusable: Designed for adaptability, enabling repeated use for in-depth forecasting.
Key Features
- Comprehensive DCF Calculator: Features detailed unlevered and levered DCF valuation models tailored for Baker Hughes Company (BKR).
- WACC Calculator: Ready-to-use Weighted Average Cost of Capital sheet with adjustable inputs specific to Baker Hughes Company (BKR).
- Customizable Forecast Assumptions: Adjust growth rates, capital expenditures, and discount rates for accurate projections.
- Integrated Financial Ratios: Evaluate profitability, leverage, and efficiency ratios relevant to Baker Hughes Company (BKR).
- Interactive Dashboard and Charts: Visual representations that summarize essential valuation metrics for straightforward analysis.
How It Works
- Step 1: Download the Excel file for Baker Hughes Company (BKR).
- Step 2: Review Baker Hughes’ pre-filled financial data and forecasts.
- Step 3: Adjust key inputs such as revenue growth, WACC, and tax rates (highlighted cells).
- Step 4: Observe the DCF model update in real-time as you modify assumptions.
- Step 5: Evaluate the outputs and leverage the results for your investment decisions.
Why Choose Baker Hughes Company (BKR)?
- Save Time: Quickly access industry insights without the hassle of extensive research.
- Enhance Accuracy: Utilize dependable data and methodologies to minimize valuation discrepancies.
- Completely Customizable: Modify tools to align with your specific operational needs and forecasts.
- Simple to Understand: Intuitive visuals and outputs facilitate straightforward analysis of results.
- Endorsed by Industry Leaders: Crafted for professionals who prioritize accuracy and efficiency.
Who Should Use Baker Hughes Company (BKR)?
- Investors: Gain insights and make informed decisions with a leading energy technology provider.
- Energy Analysts: Utilize advanced tools and data for thorough market analysis and forecasting.
- Consultants: Tailor solutions for clients in the oil and gas sector with ease and efficiency.
- Energy Enthusiasts: Explore innovative technologies and trends shaping the future of energy.
- Educators and Students: Leverage real-world case studies for a deeper understanding of the energy industry.
What the Template Contains
- Comprehensive DCF Model: Editable template featuring detailed valuation calculations for Baker Hughes Company (BKR).
- Real-World Data: Baker Hughes’ historical and projected financials preloaded for in-depth analysis.
- Customizable Parameters: Modify WACC, growth rates, and tax assumptions to explore various scenarios.
- Financial Statements: Complete annual and quarterly breakdowns for enhanced insights into Baker Hughes’ performance.
- Key Ratios: Integrated analysis for assessing profitability, efficiency, and leverage metrics.
- Dashboard with Visual Outputs: Interactive charts and tables providing clear, actionable results for decision-making.
Disclaimer
All information, articles, and product details provided on this website are for general informational and educational purposes only. We do not claim any ownership over, nor do we intend to infringe upon, any trademarks, copyrights, logos, brand names, or other intellectual property mentioned or depicted on this site. Such intellectual property remains the property of its respective owners, and any references here are made solely for identification or informational purposes, without implying any affiliation, endorsement, or partnership.
We make no representations or warranties, express or implied, regarding the accuracy, completeness, or suitability of any content or products presented. Nothing on this website should be construed as legal, tax, investment, financial, medical, or other professional advice. In addition, no part of this site—including articles or product references—constitutes a solicitation, recommendation, endorsement, advertisement, or offer to buy or sell any securities, franchises, or other financial instruments, particularly in jurisdictions where such activity would be unlawful.
All content is of a general nature and may not address the specific circumstances of any individual or entity. It is not a substitute for professional advice or services. Any actions you take based on the information provided here are strictly at your own risk. You accept full responsibility for any decisions or outcomes arising from your use of this website and agree to release us from any liability in connection with your use of, or reliance upon, the content or products found herein.