
|
Blue Dart Express Limited (Bluedart.NS) Évaluation DCF |
Entièrement Modifiable: Adapté À Vos Besoins Dans Excel Ou Sheets
Conception Professionnelle: Modèles Fiables Et Conformes Aux Normes Du Secteur
Pré-Construits Pour Une Utilisation Rapide Et Efficace
Compatible MAC/PC, entièrement débloqué
Aucune Expertise N'Est Requise; Facile À Suivre
Blue Dart Express Limited (BLUEDART.NS) Bundle
Simplifiez Blue Dart Express Limited Valuation avec cette calculatrice DCF personnalisable! Doté de Real Blue Dart Express Limited Financials et des entrées de prévision ajustées, vous pouvez tester les scénarios et découvrir la juste valeur de Blue Dart Express Limited en minutes.
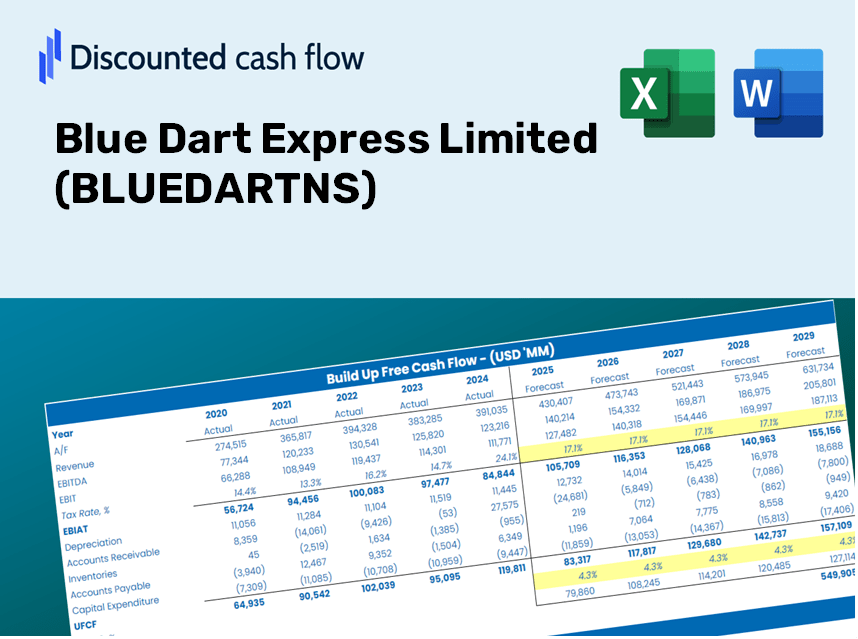
Discounted Cash Flow (DCF) - (USD MM)
| Year | AY1 2021 |
AY2 2022 |
AY3 2023 |
AY4 2024 |
AY5 2025 |
FY1 2026 |
FY2 2027 |
FY3 2028 |
FY4 2029 |
FY5 2030 |
|---|---|---|---|---|---|---|---|---|---|---|
| Revenue | 32,881.3 | 44,104.9 | 51,722.2 | 52,678.3 | 57,201.8 | 58,609.5 | 60,051.8 | 61,529.6 | 63,043.7 | 64,595.2 |
| Revenue Growth, % | 0 | 34.13 | 17.27 | 1.85 | 8.59 | 2.46 | 2.46 | 2.46 | 2.46 | 2.46 |
| EBITDA | 6,807.4 | 9,946.3 | 9,695.3 | 9,036.2 | 9,145.7 | 11,152.4 | 11,426.8 | 11,708.0 | 11,996.1 | 12,291.4 |
| EBITDA, % | 20.7 | 22.55 | 18.74 | 17.15 | 15.99 | 19.03 | 19.03 | 19.03 | 19.03 | 19.03 |
| Depreciation | 4,300.0 | 3,953.7 | 3,944.8 | 4,328.6 | 4,849.4 | 5,434.7 | 5,568.4 | 5,705.4 | 5,845.8 | 5,989.7 |
| Depreciation, % | 13.08 | 8.96 | 7.63 | 8.22 | 8.48 | 9.27 | 9.27 | 9.27 | 9.27 | 9.27 |
| EBIT | 2,507.4 | 5,992.6 | 5,750.5 | 4,707.6 | 4,296.3 | 5,717.7 | 5,858.4 | 6,002.6 | 6,150.3 | 6,301.7 |
| EBIT, % | 7.63 | 13.59 | 11.12 | 8.94 | 7.51 | 9.76 | 9.76 | 9.76 | 9.76 | 9.76 |
| Total Cash | 4,855.8 | 3,940.0 | 2,646.6 | 4,719.6 | 5,521.1 | 5,559.6 | 5,696.4 | 5,836.6 | 5,980.2 | 6,127.4 |
| Total Cash, percent | .0 | .0 | .0 | .0 | .0 | .0 | .0 | .0 | .0 | .0 |
| Account Receivables | 5,185.7 | 5,800.1 | 6,580.4 | 6,980.7 | 7,869.5 | 8,047.5 | 8,245.5 | 8,448.4 | 8,656.3 | 8,869.3 |
| Account Receivables, % | 15.77 | 13.15 | 12.72 | 13.25 | 13.76 | 13.73 | 13.73 | 13.73 | 13.73 | 13.73 |
| Inventories | 317.8 | 349.9 | 393.5 | 649.9 | 515.3 | 545.7 | 559.1 | 572.9 | 587.0 | 601.4 |
| Inventories, % | 0.96651 | 0.79334 | 0.7608 | 1.23 | 0.90085 | 0.93104 | 0.93104 | 0.93104 | 0.93104 | 0.93104 |
| Accounts Payable | 5,094.1 | 5,798.7 | 5,851.0 | 6,073.2 | 6,845.2 | 7,437.3 | 7,620.3 | 7,807.8 | 8,000.0 | 8,196.9 |
| Accounts Payable, % | 15.49 | 13.15 | 11.31 | 11.53 | 11.97 | 12.69 | 12.69 | 12.69 | 12.69 | 12.69 |
| Capital Expenditure | -1,606.0 | -1,745.6 | -5,713.6 | -2,675.4 | -2,538.9 | -3,446.9 | -3,531.8 | -3,618.7 | -3,707.7 | -3,799.0 |
| Capital Expenditure, % | -4.88 | -3.96 | -11.05 | -5.08 | -4.44 | -5.88 | -5.88 | -5.88 | -5.88 | -5.88 |
| Tax Rate, % | 27.31 | 27.31 | 27.31 | 27.31 | 27.31 | 27.31 | 27.31 | 27.31 | 27.31 | 27.31 |
| EBITAT | 1,826.2 | 4,471.0 | 4,192.7 | 3,608.4 | 3,123.1 | 4,227.6 | 4,331.6 | 4,438.2 | 4,547.5 | 4,659.4 |
| Depreciation | ||||||||||
| Changes in Account Receivables | ||||||||||
| Changes in Inventories | ||||||||||
| Changes in Accounts Payable | ||||||||||
| Capital Expenditure | ||||||||||
| UFCF | 4,110.8 | 6,737.2 | 1,652.3 | 4,827.1 | 5,451.4 | 6,599.1 | 6,339.8 | 6,495.8 | 6,655.7 | 6,819.5 |
| WACC, % | 4.75 | 4.76 | 4.75 | 4.78 | 4.75 | 4.76 | 4.76 | 4.76 | 4.76 | 4.76 |
| PV UFCF | ||||||||||
| SUM PV UFCF | 28,656.4 | |||||||||
| Long Term Growth Rate, % | 4.00 | |||||||||
| Free cash flow (T + 1) | 7,092 | |||||||||
| Terminal Value | 932,649 | |||||||||
| Present Terminal Value | 739,149 | |||||||||
| Enterprise Value | 767,805 | |||||||||
| Net Debt | 8,407 | |||||||||
| Equity Value | 759,398 | |||||||||
| Diluted Shares Outstanding, MM | 24 | |||||||||
| Equity Value Per Share | 32,004.32 |
What You Will Receive
- Pre-Filled Financial Model: Accurate DCF valuation based on Blue Dart's actual data.
- Comprehensive Forecast Control: Modify revenue growth, profit margins, WACC, and other crucial factors.
- Real-Time Calculations: Instant updates allow you to see outcomes as you make adjustments.
- Investor-Ready Template: A polished Excel file crafted for professional-level valuation.
- Customizable and Reusable: Designed for versatility, enabling repeated use for in-depth forecasts.
Key Features
- Customizable Forecast Inputs: Adjust essential parameters such as revenue growth, EBITDA margin, and capital investment.
- Instant DCF Valuation: Quickly computes intrinsic value, NPV, and additional metrics at the click of a button.
- High-Precision Accuracy: Leverages Blue Dart Express Limited’s real financial data for dependable valuation results.
- Simplified Scenario Analysis: Effortlessly explore various assumptions and evaluate outcomes side-by-side.
- Efficiency-Boosting Tool: Remove the complexity of constructing detailed valuation models from the ground up.
How It Functions
- Download the Template: Gain immediate access to the Excel-based BLUEDART DCF Calculator.
- Enter Your Assumptions: Modify the yellow-highlighted cells for growth rates, WACC, margins, and additional parameters.
- Immediate Calculations: The model automatically calculates Blue Dart's intrinsic value.
- Experiment with Scenarios: Simulate various assumptions to assess potential changes in valuation.
- Evaluate and Decide: Utilize the results to inform your investment or financial analysis.
Why Opt for Blue Dart Express Limited's Services?
- Save Time: No need to start from scratch – our solutions are ready for immediate use.
- Enhance Accuracy: Dependable logistics data and processes minimize errors in delivery.
- Completely Customizable: Adapt our services to align with your unique requirements and expectations.
- Easy to Understand: Intuitive tracking and reporting make analyzing results straightforward.
- Preferred by Professionals: Developed for businesses that prioritize efficiency and reliability.
Who Can Benefit from Blue Dart Express Limited (BLUEDARTNS)?
- Investors: Make informed choices with a reliable valuation tool tailored for the logistics industry.
- Financial Analysts: Streamline your analysis using a customizable DCF model specifically designed for Blue Dart Express Limited (BLUEDARTNS).
- Consultants: Efficiently modify the template for client portfolios or comprehensive reports on Blue Dart Express Limited (BLUEDARTNS).
- Logistics Enthusiasts: Enhance your knowledge of valuation strategies through practical, real-world applications related to Blue Dart Express Limited (BLUEDARTNS).
- Educators and Students: Utilize this tool as a hands-on resource in logistics and finance courses focused on Blue Dart Express Limited (BLUEDARTNS).
Contents of the Template
- Comprehensive DCF Model: An editable template featuring detailed valuation calculations.
- Real-World Data: Blue Dart Express Limited's historical and projected financials preloaded for in-depth analysis.
- Customizable Parameters: Modify WACC, growth rates, and tax assumptions to explore various scenarios.
- Financial Statements: Complete annual and quarterly breakdowns for enhanced insights.
- Key Ratios: Integrated analysis for assessing profitability, efficiency, and leverage.
- Dashboard with Visual Outputs: Charts and tables that provide clear, actionable results.
Disclaimer
All information, articles, and product details provided on this website are for general informational and educational purposes only. We do not claim any ownership over, nor do we intend to infringe upon, any trademarks, copyrights, logos, brand names, or other intellectual property mentioned or depicted on this site. Such intellectual property remains the property of its respective owners, and any references here are made solely for identification or informational purposes, without implying any affiliation, endorsement, or partnership.
We make no representations or warranties, express or implied, regarding the accuracy, completeness, or suitability of any content or products presented. Nothing on this website should be construed as legal, tax, investment, financial, medical, or other professional advice. In addition, no part of this site—including articles or product references—constitutes a solicitation, recommendation, endorsement, advertisement, or offer to buy or sell any securities, franchises, or other financial instruments, particularly in jurisdictions where such activity would be unlawful.
All content is of a general nature and may not address the specific circumstances of any individual or entity. It is not a substitute for professional advice or services. Any actions you take based on the information provided here are strictly at your own risk. You accept full responsibility for any decisions or outcomes arising from your use of this website and agree to release us from any liability in connection with your use of, or reliance upon, the content or products found herein.