
|
Blue Jet Healthcare Limited (BlueJet.NS) Évaluation DCF |
Entièrement Modifiable: Adapté À Vos Besoins Dans Excel Ou Sheets
Conception Professionnelle: Modèles Fiables Et Conformes Aux Normes Du Secteur
Pré-Construits Pour Une Utilisation Rapide Et Efficace
Compatible MAC/PC, entièrement débloqué
Aucune Expertise N'Est Requise; Facile À Suivre
Blue Jet Healthcare Limited (BLUEJET.NS) Bundle
Simplifier Blue Jet Healthcare Limited (BlueJetns) Valation avec cette calculatrice DCF personnalisable! Doté de Real Blue Jet Healthcare Limited (BlueJetns) Financials and Rajustement des intrants de prévision, vous pouvez tester les scénarios et découvrir la juste valeur de Blue Jet Healthcare Limited (BlueJetns) en minutes.
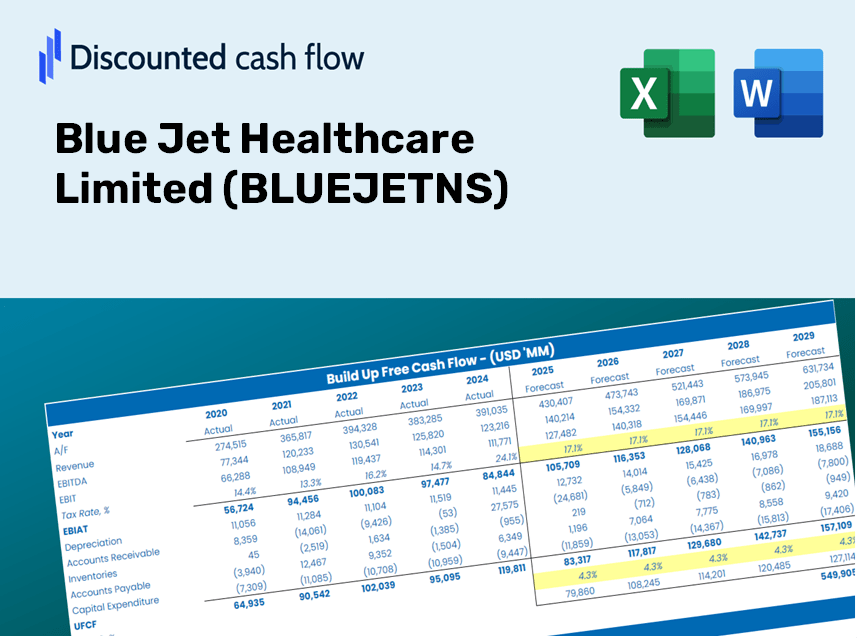
Discounted Cash Flow (DCF) - (USD MM)
| Year | AY1 2021 |
AY2 2022 |
AY3 2023 |
AY4 2024 |
AY5 2025 |
FY1 2026 |
FY2 2027 |
FY3 2028 |
FY4 2029 |
FY5 2030 |
|---|---|---|---|---|---|---|---|---|---|---|
| Revenue | 4,942.1 | 6,767.8 | 7,184.8 | 7,103.2 | 10,299.9 | 12,539.3 | 15,265.7 | 18,584.9 | 22,625.7 | 27,545.2 |
| Revenue Growth, % | 0 | 36.94 | 6.16 | -1.14 | 45 | 21.74 | 21.74 | 21.74 | 21.74 | 21.74 |
| EBITDA | 2,154.6 | 2,686.8 | 2,430.4 | 2,483.5 | 4,239.9 | 4,846.4 | 5,900.2 | 7,183.0 | 8,744.8 | 10,646.2 |
| EBITDA, % | 43.6 | 39.7 | 33.83 | 34.96 | 41.16 | 38.65 | 38.65 | 38.65 | 38.65 | 38.65 |
| Depreciation | 196.6 | 221.5 | 250.7 | 280.9 | 177.9 | 411.9 | 501.4 | 610.4 | 743.1 | 904.7 |
| Depreciation, % | 3.98 | 3.27 | 3.49 | 3.95 | 1.73 | 3.28 | 3.28 | 3.28 | 3.28 | 3.28 |
| EBIT | 1,957.9 | 2,465.3 | 2,179.7 | 2,202.6 | 4,062.0 | 4,434.6 | 5,398.8 | 6,572.6 | 8,001.7 | 9,741.5 |
| EBIT, % | 39.62 | 36.43 | 30.34 | 31.01 | 39.44 | 35.37 | 35.37 | 35.37 | 35.37 | 35.37 |
| Total Cash | 979.7 | 1,814.3 | 2,549.1 | 3,085.3 | 3,064.8 | 3,894.7 | 4,741.6 | 5,772.5 | 7,027.6 | 8,555.6 |
| Total Cash, percent | .0 | .0 | .0 | .0 | .0 | .0 | .0 | .0 | .0 | .0 |
| Account Receivables | 1,479.2 | 2,299.5 | 2,412.2 | 1,769.3 | 3,495.3 | 3,920.5 | 4,772.9 | 5,810.6 | 7,074.0 | 8,612.1 |
| Account Receivables, % | 29.93 | 33.98 | 33.57 | 24.91 | 33.94 | 31.27 | 31.27 | 31.27 | 31.27 | 31.27 |
| Inventories | 1,186.2 | 1,057.0 | 1,291.4 | 1,298.4 | 2,639.2 | 2,545.4 | 3,098.8 | 3,772.6 | 4,592.9 | 5,591.5 |
| Inventories, % | 24 | 15.62 | 17.97 | 18.28 | 25.62 | 20.3 | 20.3 | 20.3 | 20.3 | 20.3 |
| Accounts Payable | 595.3 | 565.5 | 537.9 | 303.0 | 890.5 | 1,023.2 | 1,245.7 | 1,516.5 | 1,846.2 | 2,247.7 |
| Accounts Payable, % | 12.05 | 8.36 | 7.49 | 4.27 | 8.65 | 8.16 | 8.16 | 8.16 | 8.16 | 8.16 |
| Capital Expenditure | -491.5 | -229.2 | -592.7 | -1,743.0 | -798.8 | -1,351.1 | -1,644.9 | -2,002.5 | -2,437.9 | -2,968.0 |
| Capital Expenditure, % | -9.95 | -3.39 | -8.25 | -24.54 | -7.76 | -10.78 | -10.78 | -10.78 | -10.78 | -10.78 |
| Tax Rate, % | 24.85 | 24.85 | 24.85 | 24.85 | 24.85 | 24.85 | 24.85 | 24.85 | 24.85 | 24.85 |
| EBITAT | 1,467.6 | 1,840.5 | 1,610.3 | 1,638.7 | 3,052.8 | 3,308.6 | 4,028.0 | 4,903.8 | 5,970.0 | 7,268.1 |
| Depreciation | ||||||||||
| Changes in Account Receivables | ||||||||||
| Changes in Inventories | ||||||||||
| Changes in Accounts Payable | ||||||||||
| Capital Expenditure | ||||||||||
| UFCF | -897.4 | 1,111.9 | 893.6 | 577.7 | -47.5 | 2,170.7 | 1,701.2 | 2,071.0 | 2,521.3 | 3,069.5 |
| WACC, % | 7.29 | 7.29 | 7.29 | 7.29 | 7.29 | 7.29 | 7.29 | 7.29 | 7.29 | 7.29 |
| PV UFCF | ||||||||||
| SUM PV UFCF | 9,240.5 | |||||||||
| Long Term Growth Rate, % | 2.00 | |||||||||
| Free cash flow (T + 1) | 3,131 | |||||||||
| Terminal Value | 59,209 | |||||||||
| Present Terminal Value | 41,652 | |||||||||
| Enterprise Value | 50,892 | |||||||||
| Net Debt | -998 | |||||||||
| Equity Value | 51,890 | |||||||||
| Diluted Shares Outstanding, MM | 174 | |||||||||
| Equity Value Per Share | 299.06 |
What You Will Receive
- Pre-Loaded Financial Model: Utilize Blue Jet Healthcare Limited’s (BLUEJETNS) real data for accurate DCF valuation.
- Comprehensive Forecast Control: Modify revenue growth, profit margins, WACC, and other essential metrics.
- Real-Time Calculations: Automatic updates provide immediate insights as adjustments are made.
- Professional-Grade Template: A polished Excel file crafted for high-quality valuations.
- Flexible and Reusable: Designed for versatility, enabling multiple uses for in-depth forecasting.
Key Features
- Real-Time BLUEJETNS Data: Pre-loaded with Blue Jet Healthcare Limited’s historical financials and future projections.
- Fully Customizable Inputs: Tailor revenue growth, profit margins, discount rates, tax obligations, and capital investments to your needs.
- Dynamic Valuation Model: Automatic recalibration of Net Present Value (NPV) and intrinsic value based on your specified inputs.
- Scenario Analysis: Develop multiple forecasting scenarios to explore various valuation results.
- User-Friendly Interface: Intuitive and well-organized, making it accessible for both professionals and novices.
How It Works
- Step 1: Download the prebuilt Excel template with Blue Jet Healthcare Limited's (BLUEJETNS) data included.
- Step 2: Navigate through the pre-filled sheets to familiarize yourself with the key metrics.
- Step 3: Adjust forecasts and assumptions in the editable yellow cells (WACC, growth, margins).
- Step 4: Instantly view the recalculated results, including Blue Jet Healthcare Limited's (BLUEJETNS) intrinsic value.
- Step 5: Utilize the outputs to make informed investment decisions or create detailed reports.
Why Opt for This Calculator?
- Precision: Utilizes authentic Blue Jet Healthcare financials for reliable data.
- Adaptability: Built to allow users to easily explore and adjust inputs as needed.
- Efficiency: Bypass the complexities of creating a DCF model from the ground up.
- High-Quality: Crafted with the expertise and usability expected at the CFO level.
- Intuitive: Simple to navigate, making it accessible for users without advanced financial background.
Who Can Benefit from This Product?
- Healthcare Investors: Develop comprehensive and dependable valuation models for portfolio assessments.
- Corporate Finance Departments: Evaluate valuation scenarios to inform organizational strategy.
- Consultants and Advisors: Deliver precise valuation insights for Blue Jet Healthcare Limited (BLUEJETNS) to clients.
- Students and Educators: Utilize real-world data for practical applications and teaching in financial modeling.
- Healthcare Enthusiasts: Gain insights into how healthcare companies like Blue Jet Healthcare Limited (BLUEJETNS) are valued in the marketplace.
Contents of the Template
- Pre-Filled Data: Contains Blue Jet Healthcare Limited's historical financial performance and projections.
- Discounted Cash Flow Model: An adjustable DCF valuation model featuring automatic calculations.
- Weighted Average Cost of Capital (WACC): A dedicated spreadsheet for WACC calculations based on user-defined inputs.
- Key Financial Ratios: Evaluate Blue Jet Healthcare's profitability, operational efficiency, and financial leverage.
- Customizable Inputs: Easily modify revenue growth rates, profit margins, and tax rates.
- Clear Dashboard: Visualizations and tables summarizing essential valuation outcomes.
Disclaimer
All information, articles, and product details provided on this website are for general informational and educational purposes only. We do not claim any ownership over, nor do we intend to infringe upon, any trademarks, copyrights, logos, brand names, or other intellectual property mentioned or depicted on this site. Such intellectual property remains the property of its respective owners, and any references here are made solely for identification or informational purposes, without implying any affiliation, endorsement, or partnership.
We make no representations or warranties, express or implied, regarding the accuracy, completeness, or suitability of any content or products presented. Nothing on this website should be construed as legal, tax, investment, financial, medical, or other professional advice. In addition, no part of this site—including articles or product references—constitutes a solicitation, recommendation, endorsement, advertisement, or offer to buy or sell any securities, franchises, or other financial instruments, particularly in jurisdictions where such activity would be unlawful.
All content is of a general nature and may not address the specific circumstances of any individual or entity. It is not a substitute for professional advice or services. Any actions you take based on the information provided here are strictly at your own risk. You accept full responsibility for any decisions or outcomes arising from your use of this website and agree to release us from any liability in connection with your use of, or reliance upon, the content or products found herein.