
|
Croyez l'évaluation DCF S.A. (Blv.PA) |
Entièrement Modifiable: Adapté À Vos Besoins Dans Excel Ou Sheets
Conception Professionnelle: Modèles Fiables Et Conformes Aux Normes Du Secteur
Pré-Construits Pour Une Utilisation Rapide Et Efficace
Compatible MAC/PC, entièrement débloqué
Aucune Expertise N'Est Requise; Facile À Suivre
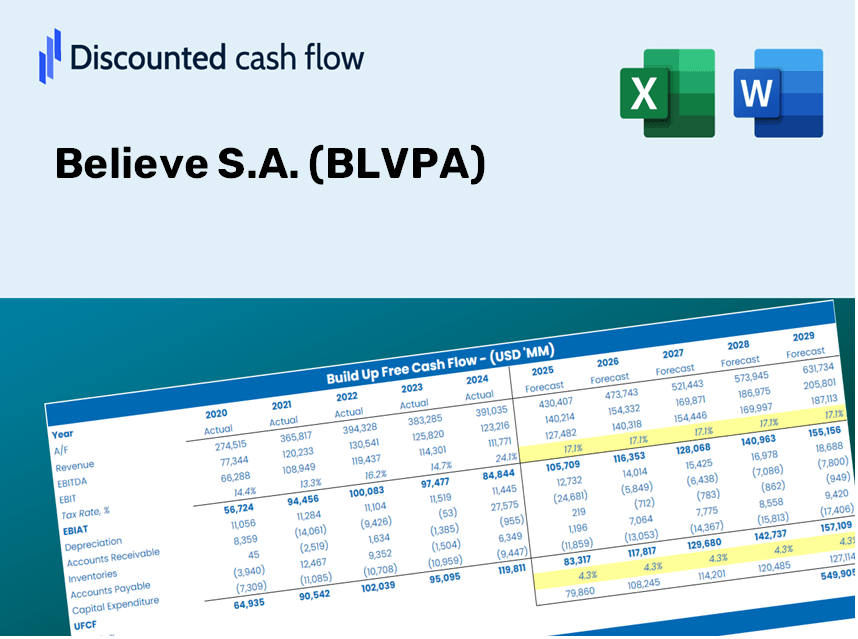
Believe S.A. (BLV.PA) Bundle
Gagnez la maîtrise sur votre analyse d'évaluation de croire S.A. (BLVPA) à l'aide de notre calculatrice DCF de pointe! Équipé de données réelles (BLVPA), ce modèle Excel vous permet d'ajuster les prévisions et les hypothèses pour déterminer avec précision la valeur intrinsèque de croire S.A. (BLVPA).
Discounted Cash Flow (DCF) - (USD MM)
| Year | AY1 2020 |
AY2 2021 |
AY3 2022 |
AY4 2023 |
AY5 2024 |
FY1 2025 |
FY2 2026 |
FY3 2027 |
FY4 2028 |
FY5 2029 |
|---|---|---|---|---|---|---|---|---|---|---|
| Revenue | 441.4 | 577.2 | 760.8 | 880.3 | 988.8 | 1,212.8 | 1,487.5 | 1,824.5 | 2,237.7 | 2,744.6 |
| Revenue Growth, % | 0 | 30.75 | 31.82 | 15.71 | 12.33 | 22.65 | 22.65 | 22.65 | 22.65 | 22.65 |
| EBITDA | 8.2 | 8.3 | 31.4 | 55.5 | 40.3 | 43.2 | 52.9 | 64.9 | 79.7 | 97.7 |
| EBITDA, % | 1.86 | 1.44 | 4.13 | 6.3 | 4.07 | 3.56 | 3.56 | 3.56 | 3.56 | 3.56 |
| Depreciation | 24.7 | 33.7 | 44.9 | 61.3 | 40.6 | 68.9 | 84.5 | 103.6 | 127.1 | 155.9 |
| Depreciation, % | 5.59 | 5.84 | 5.9 | 6.96 | 4.1 | 5.68 | 5.68 | 5.68 | 5.68 | 5.68 |
| EBIT | -16.5 | -25.4 | -13.4 | -5.8 | -.3 | -25.7 | -31.5 | -38.7 | -47.4 | -58.2 |
| EBIT, % | -3.73 | -4.4 | -1.77 | -0.66147 | -0.0327661 | -2.12 | -2.12 | -2.12 | -2.12 | -2.12 |
| Total Cash | 152.3 | 262.7 | 304.3 | 215.6 | 143.8 | 385.8 | 473.2 | 580.4 | 711.9 | 873.1 |
| Total Cash, percent | .0 | .0 | .0 | .0 | .0 | .0 | .0 | .0 | .0 | .0 |
| Account Receivables | 110.4 | 136.6 | 186.3 | 226.1 | 250.3 | 301.1 | 369.4 | 453.0 | 555.6 | 681.5 |
| Account Receivables, % | 25 | 23.67 | 24.49 | 25.68 | 25.31 | 24.83 | 24.83 | 24.83 | 24.83 | 24.83 |
| Inventories | 4.0 | 4.6 | 5.6 | 4.1 | 4.0 | 8.1 | 9.9 | 12.1 | 14.9 | 18.2 |
| Inventories, % | 0.90911 | 0.80256 | 0.73948 | 0.46688 | 0.40381 | 0.66437 | 0.66437 | 0.66437 | 0.66437 | 0.66437 |
| Accounts Payable | 178.0 | 388.7 | 458.4 | 558.4 | 605.6 | 709.7 | 870.5 | 1,067.7 | 1,309.5 | 1,606.1 |
| Accounts Payable, % | 40.33 | 67.35 | 60.25 | 63.43 | 61.24 | 58.52 | 58.52 | 58.52 | 58.52 | 58.52 |
| Capital Expenditure | -34.7 | -26.7 | -25.5 | -49.2 | -43.0 | -62.5 | -76.7 | -94.0 | -115.3 | -141.4 |
| Capital Expenditure, % | -7.85 | -4.63 | -3.35 | -5.59 | -4.35 | -5.15 | -5.15 | -5.15 | -5.15 | -5.15 |
| Tax Rate, % | 158.99 | 158.99 | 158.99 | 158.99 | 158.99 | 158.99 | 158.99 | 158.99 | 158.99 | 158.99 |
| EBITAT | -22.4 | -27.8 | -24.2 | -4.2 | .2 | -19.2 | -23.5 | -28.8 | -35.3 | -43.3 |
| Depreciation | ||||||||||
| Changes in Account Receivables | ||||||||||
| Changes in Inventories | ||||||||||
| Changes in Accounts Payable | ||||||||||
| Capital Expenditure | ||||||||||
| UFCF | 31.3 | 163.0 | 14.2 | 69.7 | 20.8 | 36.4 | 75.0 | 92.0 | 112.9 | 138.5 |
| WACC, % | 9.71 | 9.71 | 9.71 | 9.67 | 9.57 | 9.68 | 9.68 | 9.68 | 9.68 | 9.68 |
| PV UFCF | ||||||||||
| SUM PV UFCF | 330.6 | |||||||||
| Long Term Growth Rate, % | 3.50 | |||||||||
| Free cash flow (T + 1) | 143 | |||||||||
| Terminal Value | 2,320 | |||||||||
| Present Terminal Value | 1,462 | |||||||||
| Enterprise Value | 1,793 | |||||||||
| Net Debt | -100 | |||||||||
| Equity Value | 1,892 | |||||||||
| Diluted Shares Outstanding, MM | 99 | |||||||||
| Equity Value Per Share | 19.11 |
Benefits of Choosing Believe S.A. (BLVPA)
- Comprehensive BLVPA Financial Data: Access both historical and projected figures for precise valuation.
- Customizable Parameters: Adjust WACC, tax rates, revenue growth, and capital expenditures as needed.
- Real-Time Calculations: Instantly compute intrinsic value and NPV with dynamic functionality.
- Scenario Planning: Explore various scenarios to assess Believe S.A.'s future potential.
- User-Friendly Interface: Designed for experts while remaining approachable for newcomers.
Key Features
- Comprehensive BLVPA Data: Loaded with Believe S.A.'s historical financial performance and future projections.
- Fully Customizable Parameters: Modify revenue growth rates, profit margins, discount rates, tax percentages, and capital expenditures as needed.
- Interactive Valuation Model: Automatically refreshes Net Present Value (NPV) and intrinsic value based on your adjustments.
- Versatile Scenario Analysis: Develop various forecasting scenarios to evaluate different valuation possibilities.
- Intuitive User Interface: Designed to be straightforward and accessible for both experienced professionals and newcomers.
How It Works
- Download the Template: Gain immediate access to the Excel-based Believe S.A. (BLVPA) DCF Calculator.
- Input Your Assumptions: Modify the yellow-highlighted cells with your growth rates, WACC, margins, and more.
- Instant Calculations: The model dynamically recalculates Believe S.A.'s intrinsic value.
- Test Scenarios: Explore various assumptions to assess potential changes in valuation.
- Analyze and Decide: Utilize the findings to inform your investment or financial analysis.
Why Choose the Believe S.A. (BLVPA) Calculator?
- All-in-One Solution: Offers DCF, WACC, and financial ratio assessments seamlessly integrated.
- Flexible Inputs: Modify the yellow-highlighted fields to explore different scenarios.
- In-Depth Analysis: Automatically computes the intrinsic value and Net Present Value for Believe S.A. (BLVPA).
- Ready-to-Use Data: Comes with historical and forecasted data for reliable starting points.
- High-Quality Standards: Perfect for financial analysts, investors, and business advisors.
Who Can Benefit from Believe S.A. (BLVPA)?
- Investors: Empower your investment choices with our advanced valuation tools.
- Financial Analysts: Enhance your efficiency with our customizable pre-built DCF models.
- Consultants: Easily modify templates to create impactful presentations or reports for your clients.
- Finance Enthusiasts: Expand your knowledge of valuation methods through practical, real-life examples.
- Educators and Students: Utilize this resource as a hands-on learning aid in finance-related studies.
Contents of the Template
- Preloaded BLVPA Data: Historical and forecasted financial figures, including revenue, EBIT, and capital expenditures.
- DCF and WACC Models: Advanced spreadsheets for determining intrinsic value and Weighted Average Cost of Capital.
- Editable Inputs: Yellow-highlighted cells for modifying revenue growth rates, tax percentages, and discount rates.
- Financial Statements: Detailed annual and quarterly financial documents for in-depth analysis.
- Key Ratios: Ratios assessing profitability, leverage, and efficiency to gauge performance.
- Dashboard and Charts: Visual representations of valuation results and underlying assumptions.
Disclaimer
All information, articles, and product details provided on this website are for general informational and educational purposes only. We do not claim any ownership over, nor do we intend to infringe upon, any trademarks, copyrights, logos, brand names, or other intellectual property mentioned or depicted on this site. Such intellectual property remains the property of its respective owners, and any references here are made solely for identification or informational purposes, without implying any affiliation, endorsement, or partnership.
We make no representations or warranties, express or implied, regarding the accuracy, completeness, or suitability of any content or products presented. Nothing on this website should be construed as legal, tax, investment, financial, medical, or other professional advice. In addition, no part of this site—including articles or product references—constitutes a solicitation, recommendation, endorsement, advertisement, or offer to buy or sell any securities, franchises, or other financial instruments, particularly in jurisdictions where such activity would be unlawful.
All content is of a general nature and may not address the specific circumstances of any individual or entity. It is not a substitute for professional advice or services. Any actions you take based on the information provided here are strictly at your own risk. You accept full responsibility for any decisions or outcomes arising from your use of this website and agree to release us from any liability in connection with your use of, or reliance upon, the content or products found herein.