
|
B&M European Value Retail S.A. (BME.L) Évaluation DCF |
Entièrement Modifiable: Adapté À Vos Besoins Dans Excel Ou Sheets
Conception Professionnelle: Modèles Fiables Et Conformes Aux Normes Du Secteur
Pré-Construits Pour Une Utilisation Rapide Et Efficace
Compatible MAC/PC, entièrement débloqué
Aucune Expertise N'Est Requise; Facile À Suivre
B&M European Value Retail S.A. (BME.L) Bundle
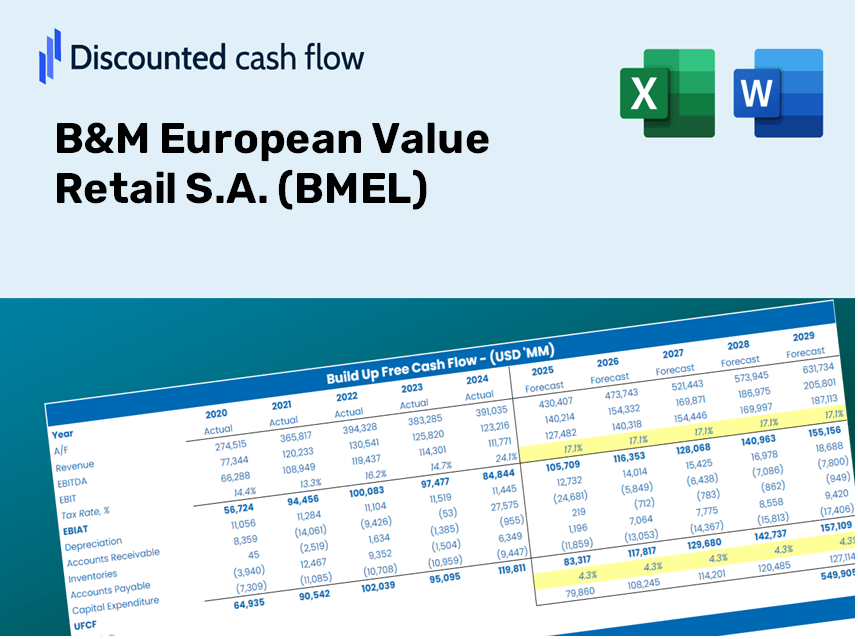
Conçu pour la précision, notre calculatrice (BMEL) DCF vous permet d'évaluer l'évaluation de la valeur European B&M Retail S.A. à l'aide de données financières du monde réel et offre la flexibilité pour modifier tous les paramètres clés pour des projections améliorées.
What You Will Receive
- Authentic BMEL Financial Data: Pre-loaded with B&M European Value Retail’s historical and forecasted figures for accurate analysis.
- Completely Customizable Template: Effortlessly adjust critical inputs such as revenue growth, WACC, and EBITDA %.
- Instant Calculations: Watch as the intrinsic value for B&M updates immediately with your modifications.
- Professional Valuation Tool: Tailored for investors, analysts, and consultants in search of precise DCF results.
- Intuitive Design: User-friendly layout and straightforward instructions suitable for all skill levels.
Key Features
- Comprehensive Historical Data: Access B&M European Value Retail S.A.'s (BMEL) past financial statements along with pre-populated forecasts.
- Customizable Parameters: Modify WACC, tax rates, revenue growth, and EBITDA margins to fit your analysis.
- Real-Time Calculations: Watch the intrinsic value of B&M European Value Retail S.A. (BMEL) update instantly as inputs change.
- User-Friendly Visuals: Intuitive dashboard charts illustrate valuation outcomes and essential metrics.
- Designed for Precision: A reliable resource tailored for analysts, investors, and finance professionals.
How It Functions
- Step 1: Download the Excel document.
- Step 2: Examine B&M European Value Retail S.A.'s (BMEL) pre-filled financial data and projections.
- Step 3: Adjust key inputs such as revenue growth, WACC, and tax rates (highlighted cells).
- Step 4: Observe the DCF model update in real-time as you modify your assumptions.
- Step 5: Evaluate the outputs and leverage the results for your investment choices.
Why Opt for This Calculator for B&M European Value Retail S.A. (BMEL)?
- Reliable Data: Utilize accurate financial information from B&M European Value Retail for trustworthy valuation outcomes.
- Tailorable: Modify essential parameters like growth rates, WACC, and tax rates to fit your financial outlook.
- Efficiency Boost: Ready-made calculations streamline the process, saving you time and effort.
- Professional Tool: Crafted specifically for investors, analysts, and consultants in the retail sector.
- Easy to Use: With a user-friendly interface and clear, step-by-step guidance, it’s accessible for everyone.
Who Should Consider Using This Product?
- Investors: Evaluate B&M European Value Retail S.A. (BMEL) valuation before making buying or selling decisions.
- CFOs and Financial Analysts: Optimize valuation processes and validate economic forecasts for BMEL.
- Startup Founders: Discover how established firms like B&M European Value Retail S.A. (BMEL) are assessed in the market.
- Consultants: Create comprehensive valuation reports tailored for clients using BMEL data.
- Students and Educators: Apply real-time information to learn and teach valuation methodologies using BMEL as a case study.
What the Template Includes
- Comprehensive DCF Model: An editable template featuring detailed valuation calculations.
- Real-World Data: Historical and projected financials for B&M European Value Retail S.A. (BMEL) preloaded for your analysis.
- Customizable Parameters: Modify WACC, growth rates, and tax assumptions to explore various scenarios.
- Financial Statements: Complete annual and quarterly breakdowns for in-depth insights.
- Key Ratios: Integrated analysis for profitability, efficiency, and financial leverage.
- Dashboard with Visual Outputs: Charts and tables designed for clear, actionable insights.
Disclaimer
All information, articles, and product details provided on this website are for general informational and educational purposes only. We do not claim any ownership over, nor do we intend to infringe upon, any trademarks, copyrights, logos, brand names, or other intellectual property mentioned or depicted on this site. Such intellectual property remains the property of its respective owners, and any references here are made solely for identification or informational purposes, without implying any affiliation, endorsement, or partnership.
We make no representations or warranties, express or implied, regarding the accuracy, completeness, or suitability of any content or products presented. Nothing on this website should be construed as legal, tax, investment, financial, medical, or other professional advice. In addition, no part of this site—including articles or product references—constitutes a solicitation, recommendation, endorsement, advertisement, or offer to buy or sell any securities, franchises, or other financial instruments, particularly in jurisdictions where such activity would be unlawful.
All content is of a general nature and may not address the specific circumstances of any individual or entity. It is not a substitute for professional advice or services. Any actions you take based on the information provided here are strictly at your own risk. You accept full responsibility for any decisions or outcomes arising from your use of this website and agree to release us from any liability in connection with your use of, or reliance upon, the content or products found herein.