
|
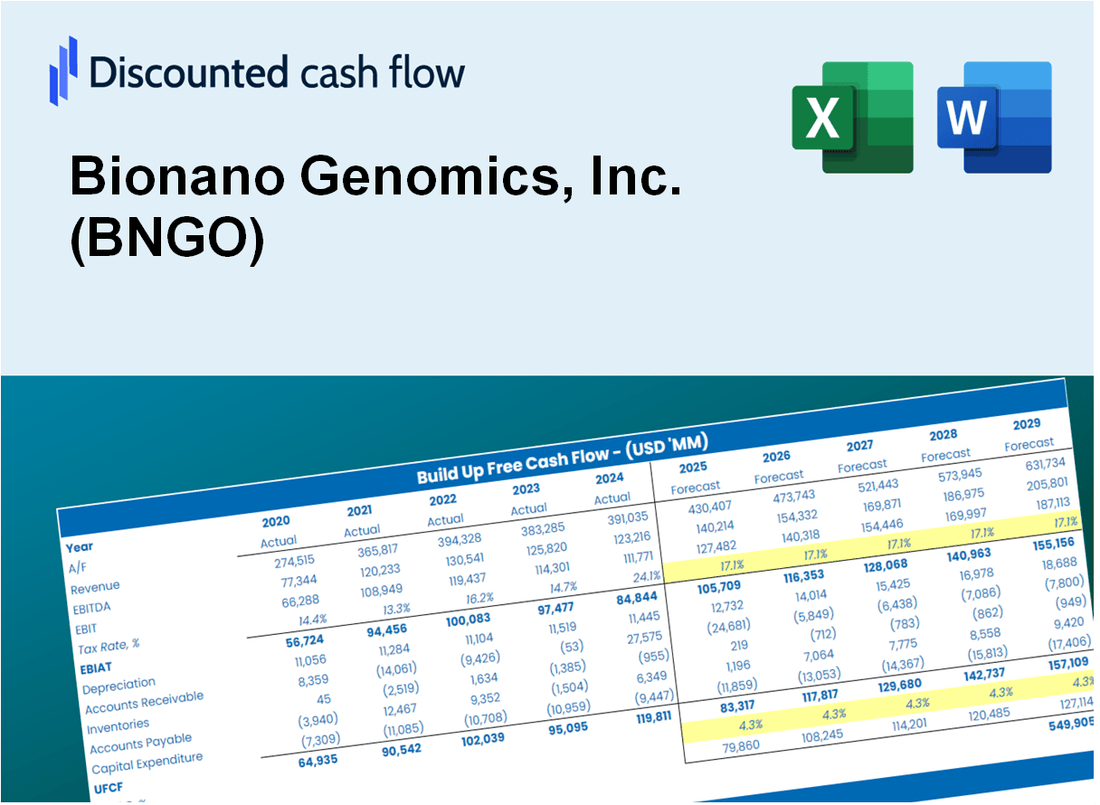
Bionano Genomics, Inc. (BNGO) Évaluation DCF |
Entièrement Modifiable: Adapté À Vos Besoins Dans Excel Ou Sheets
Conception Professionnelle: Modèles Fiables Et Conformes Aux Normes Du Secteur
Pré-Construits Pour Une Utilisation Rapide Et Efficace
Compatible MAC/PC, entièrement débloqué
Aucune Expertise N'Est Requise; Facile À Suivre
Bionano Genomics, Inc. (BNGO) Bundle
Simplifiez l'évaluation de Bionano Genomics, Inc. (BNGO) avec cette calculatrice DCF personnalisable! Doté de Real Bionano Genomics, Inc. (BNGO) Financials and Adjustable Prévision des intrants, vous pouvez tester les scénarios et découvrir la juste valeur de Bionano Genomics, Inc. (BNGO) en minutes.
What You Will Get
- Real BNGO Financials: Includes historical and forecasted data for accurate valuation.
- Adjustable Inputs: Modify WACC, tax rates, revenue growth, and capital expenditures.
- Automatic Calculations: Intrinsic value and NPV are calculated dynamically.
- Scenario Analysis: Test multiple scenarios to evaluate Bionano Genomics’ future performance.
- Clear and Intuitive Design: Built for professionals yet accessible for beginners.
Key Features
- Comprehensive Genomic Data: Access reliable pre-loaded historical data and future projections for Bionano Genomics (BNGO).
- Tailored Analysis Parameters: Modify highlighted cells for key metrics like growth rates, sequencing costs, and market penetration.
- Real-Time Updates: Automatic recalculations for financial models, including DCF, Net Present Value (NPV), and revenue forecasts.
- Interactive Visualization Tools: User-friendly charts and summaries to effectively present your genomic analysis outcomes.
- Designed for All Levels: An accessible layout suitable for researchers, analysts, and industry professionals.
How It Works
- Step 1: Download the prebuilt Excel template with Bionano Genomics’ data included.
- Step 2: Explore the pre-filled sheets and familiarize yourself with the key metrics.
- Step 3: Update forecasts and assumptions in the editable yellow cells (WACC, growth, margins).
- Step 4: Instantly view recalculated results, including Bionano Genomics’ intrinsic value.
- Step 5: Make informed investment decisions or generate reports using the outputs.
Why Choose This Calculator for Bionano Genomics, Inc. (BNGO)?
- Accurate Data: Real Bionano Genomics financials ensure reliable valuation results.
- Customizable: Adjust key parameters like growth rates, WACC, and tax rates to align with your forecasts.
- Time-Saving: Pre-built calculations streamline the process, eliminating the need to start from scratch.
- Professional-Grade Tool: Tailored for investors, analysts, and consultants in the biotech sector.
- User-Friendly: Intuitive design and step-by-step guidance make it accessible for all users.
Who Should Use This Product?
- Genomics Researchers: Explore advanced genomic analysis techniques using real-world data from Bionano Genomics (BNGO).
- Academics: Integrate cutting-edge genomic models into your studies or research projects.
- Investors: Evaluate your investment strategies and analyze the market performance of Bionano Genomics (BNGO).
- Bioinformatics Analysts: Enhance your analysis process with a customizable genomic data interpretation model.
- Healthcare Professionals: Understand how genomic data impacts the analysis of large biotech companies like Bionano Genomics (BNGO).
What the Template Contains
- Pre-Filled DCF Model: Bionano Genomics’ financial data preloaded for immediate use.
- WACC Calculator: Detailed calculations for Weighted Average Cost of Capital.
- Financial Ratios: Evaluate Bionano Genomics’ profitability, leverage, and efficiency.
- Editable Inputs: Change assumptions such as growth, margins, and CAPEX to fit your scenarios.
- Financial Statements: Annual and quarterly reports to support detailed analysis.
- Interactive Dashboard: Easily visualize key valuation metrics and results.
Disclaimer
All information, articles, and product details provided on this website are for general informational and educational purposes only. We do not claim any ownership over, nor do we intend to infringe upon, any trademarks, copyrights, logos, brand names, or other intellectual property mentioned or depicted on this site. Such intellectual property remains the property of its respective owners, and any references here are made solely for identification or informational purposes, without implying any affiliation, endorsement, or partnership.
We make no representations or warranties, express or implied, regarding the accuracy, completeness, or suitability of any content or products presented. Nothing on this website should be construed as legal, tax, investment, financial, medical, or other professional advice. In addition, no part of this site—including articles or product references—constitutes a solicitation, recommendation, endorsement, advertisement, or offer to buy or sell any securities, franchises, or other financial instruments, particularly in jurisdictions where such activity would be unlawful.
All content is of a general nature and may not address the specific circumstances of any individual or entity. It is not a substitute for professional advice or services. Any actions you take based on the information provided here are strictly at your own risk. You accept full responsibility for any decisions or outcomes arising from your use of this website and agree to release us from any liability in connection with your use of, or reliance upon, the content or products found herein.