
|
Borr Drilling Limited (Borr) Évaluation DCF |
Entièrement Modifiable: Adapté À Vos Besoins Dans Excel Ou Sheets
Conception Professionnelle: Modèles Fiables Et Conformes Aux Normes Du Secteur
Pré-Construits Pour Une Utilisation Rapide Et Efficace
Compatible MAC/PC, entièrement débloqué
Aucune Expertise N'Est Requise; Facile À Suivre
Borr Drilling Limited (BORR) Bundle
Simplifier l'évaluation Borr Drilling Limited (Borr) avec cette calculatrice DCF personnalisable! Doté de la juste valeur financière Borr Drilling Limite.
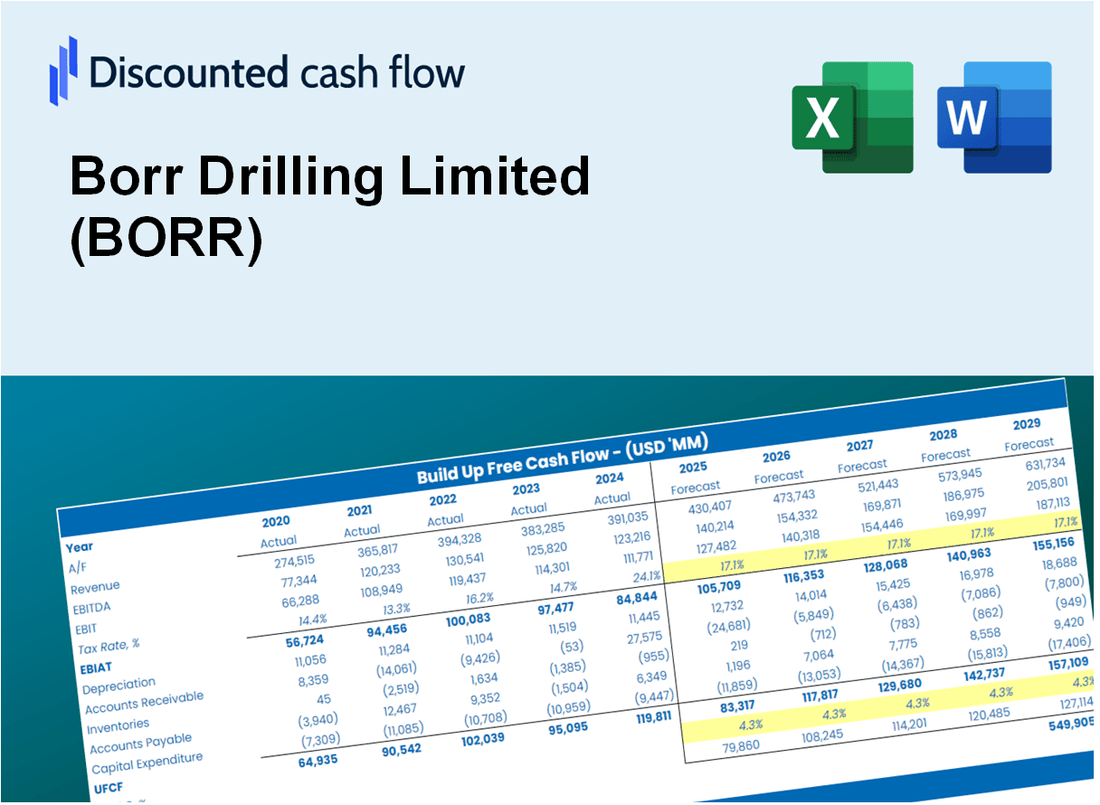
Discounted Cash Flow (DCF) - (USD MM)
| Year | AY1 2020 |
AY2 2021 |
AY3 2022 |
AY4 2023 |
AY5 2024 |
FY1 2025 |
FY2 2026 |
FY3 2027 |
FY4 2028 |
FY5 2029 |
|---|---|---|---|---|---|---|---|---|---|---|
| Revenue | 307.5 | 245.3 | 443.8 | 771.6 | 1,010.6 | 1,428.8 | 2,020.1 | 2,856.1 | 4,038.0 | 5,709.0 |
| Revenue Growth, % | 0 | -20.23 | 80.92 | 73.86 | 30.97 | 41.38 | 41.38 | 41.38 | 41.38 | 41.38 |
| EBITDA | -96.1 | 29.2 | -32.5 | 331.9 | 473.0 | 180.5 | 255.1 | 360.7 | 510.0 | 721.0 |
| EBITDA, % | -31.25 | 11.9 | -7.32 | 43.01 | 46.8 | 12.63 | 12.63 | 12.63 | 12.63 | 12.63 |
| Depreciation | 117.9 | 119.6 | 116.5 | 117.4 | 131.2 | 404.5 | 571.9 | 808.5 | 1,143.1 | 1,616.2 |
| Depreciation, % | 38.34 | 48.76 | 26.25 | 15.22 | 12.98 | 28.31 | 28.31 | 28.31 | 28.31 | 28.31 |
| EBIT | -214.0 | -90.4 | -149.0 | 214.5 | 341.8 | -224.0 | -316.7 | -447.8 | -633.1 | -895.2 |
| EBIT, % | -69.59 | -36.85 | -33.57 | 27.8 | 33.82 | -15.68 | -15.68 | -15.68 | -15.68 | -15.68 |
| Total Cash | 19.2 | 34.9 | 108.0 | 102.5 | 61.6 | 183.4 | 259.3 | 366.6 | 518.4 | 732.9 |
| Total Cash, percent | .0 | .0 | .0 | .0 | .0 | .0 | .0 | .0 | .0 | .0 |
| Account Receivables | 103.2 | 113.1 | 190.9 | 255.9 | 404.2 | 559.6 | 791.2 | 1,118.7 | 1,581.6 | 2,236.1 |
| Account Receivables, % | 33.56 | 46.11 | 43.01 | 33.16 | 40 | 39.17 | 39.17 | 39.17 | 39.17 | 39.17 |
| Inventories | .0 | .0 | .0 | .0 | .0 | .0 | .0 | .0 | .0 | .0 |
| Inventories, % | 0 | 0 | 0 | 0 | 0 | 0 | 0 | 0 | 0 | 0 |
| Accounts Payable | 20.4 | 34.7 | 47.7 | 35.5 | 81.6 | 126.3 | 178.6 | 252.5 | 357.0 | 504.7 |
| Accounts Payable, % | 6.63 | 14.15 | 10.75 | 4.6 | 8.07 | 8.84 | 8.84 | 8.84 | 8.84 | 8.84 |
| Capital Expenditure | -42.4 | -18.9 | -83.3 | -114.0 | -409.4 | -273.0 | -386.0 | -545.8 | -771.6 | -1,091.0 |
| Capital Expenditure, % | -13.79 | -7.7 | -18.77 | -14.77 | -40.51 | -19.11 | -19.11 | -19.11 | -19.11 | -19.11 |
| Tax Rate, % | 41.48 | 41.48 | 41.48 | 41.48 | 41.48 | 41.48 | 41.48 | 41.48 | 41.48 | 41.48 |
| EBITAT | -225.5 | -95.2 | -159.0 | 84.5 | 200.0 | -178.3 | -252.1 | -356.4 | -503.9 | -712.4 |
| Depreciation | ||||||||||
| Changes in Account Receivables | ||||||||||
| Changes in Inventories | ||||||||||
| Changes in Accounts Payable | ||||||||||
| Capital Expenditure | ||||||||||
| UFCF | -232.8 | 9.9 | -190.6 | 10.7 | -180.4 | -157.6 | -245.6 | -347.2 | -490.8 | -694.0 |
| WACC, % | 9.98 | 9.98 | 9.98 | 5.47 | 6.89 | 8.46 | 8.46 | 8.46 | 8.46 | 8.46 |
| PV UFCF | ||||||||||
| SUM PV UFCF | -1,443.1 | |||||||||
| Long Term Growth Rate, % | 2.00 | |||||||||
| Free cash flow (T + 1) | -708 | |||||||||
| Terminal Value | -10,952 | |||||||||
| Present Terminal Value | -7,296 | |||||||||
| Enterprise Value | -8,739 | |||||||||
| Net Debt | 2,049 | |||||||||
| Equity Value | -10,789 | |||||||||
| Diluted Shares Outstanding, MM | 254 | |||||||||
| Equity Value Per Share | -42.40 |
What You Will Get
- Authentic Borr Drilling Data: Preloaded financials – including revenue and EBIT – derived from actual and projected figures.
- Comprehensive Customization: Modify all essential parameters (yellow cells) such as WACC, growth %, and tax rates.
- Instant Valuation Updates: Automatic recalculations to evaluate the effects of changes on Borr Drilling’s fair value.
- Flexible Excel Template: Designed for quick modifications, scenario analysis, and detailed forecasts.
- Efficient and Precise: Avoid the hassle of building models from the ground up while ensuring accuracy and adaptability.
Key Features
- Comprehensive BORR Data: Pre-loaded with Borr Drilling's historical performance and future projections.
- Customizable Parameters: Modify drilling rates, operational costs, revenue forecasts, and investment strategies.
- Interactive Valuation Model: Instant updates to Net Present Value (NPV) and intrinsic value based on your adjustments.
- Scenario Analysis: Develop various forecasting scenarios to evaluate different valuation results.
- User-Centric Interface: Intuitive, well-structured, catering to both industry experts and newcomers.
How It Works
- Download the Template: Gain immediate access to the Excel-based BORR DCF Calculator.
- Input Your Assumptions: Modify the yellow-highlighted cells for growth rates, WACC, margins, and additional parameters.
- Instant Calculations: The model automatically recalculates Borr Drilling's intrinsic value.
- Test Scenarios: Experiment with various assumptions to assess potential changes in valuation.
- Analyze and Decide: Utilize the findings to inform your investment or financial analysis.
Why Choose Borr Drilling Limited (BORR) Calculator?
- Accuracy: Utilizes real Borr Drilling financials for precise data representation.
- Flexibility: Tailored for users to easily test and adjust inputs as needed.
- Time-Saving: Eliminate the complexities of constructing a DCF model from the ground up.
- Professional-Grade: Crafted with the expertise and usability expected by CFOs.
- User-Friendly: Intuitive design makes it accessible for users without extensive financial modeling skills.
Who Should Use This Product?
- Finance Students: Master valuation methods and practice with real market data for Borr Drilling Limited (BORR).
- Academics: Integrate industry-standard models into your research or teaching materials.
- Investors: Validate your investment hypotheses and evaluate valuation results for Borr Drilling Limited (BORR).
- Analysts: Enhance your analysis process with a ready-to-use, customizable DCF model tailored for Borr Drilling Limited (BORR).
- Small Business Owners: Understand the valuation techniques used for larger public entities like Borr Drilling Limited (BORR).
What the Template Contains
- Preloaded BORR Data: Historical and projected financial data, including revenue, EBIT, and capital expenditures.
- DCF and WACC Models: Professional-grade sheets for calculating intrinsic value and Weighted Average Cost of Capital.
- Editable Inputs: Yellow-highlighted cells for adjusting revenue growth, tax rates, and discount rates.
- Financial Statements: Comprehensive annual and quarterly financials for deeper analysis.
- Key Ratios: Profitability, leverage, and efficiency ratios to evaluate performance.
- Dashboard and Charts: Visual summaries of valuation outcomes and assumptions.
Disclaimer
All information, articles, and product details provided on this website are for general informational and educational purposes only. We do not claim any ownership over, nor do we intend to infringe upon, any trademarks, copyrights, logos, brand names, or other intellectual property mentioned or depicted on this site. Such intellectual property remains the property of its respective owners, and any references here are made solely for identification or informational purposes, without implying any affiliation, endorsement, or partnership.
We make no representations or warranties, express or implied, regarding the accuracy, completeness, or suitability of any content or products presented. Nothing on this website should be construed as legal, tax, investment, financial, medical, or other professional advice. In addition, no part of this site—including articles or product references—constitutes a solicitation, recommendation, endorsement, advertisement, or offer to buy or sell any securities, franchises, or other financial instruments, particularly in jurisdictions where such activity would be unlawful.
All content is of a general nature and may not address the specific circumstances of any individual or entity. It is not a substitute for professional advice or services. Any actions you take based on the information provided here are strictly at your own risk. You accept full responsibility for any decisions or outcomes arising from your use of this website and agree to release us from any liability in connection with your use of, or reliance upon, the content or products found herein.