
|
Bharat Petroleum Corporation Limited (BPCL.NS) Évaluation DCF |
Entièrement Modifiable: Adapté À Vos Besoins Dans Excel Ou Sheets
Conception Professionnelle: Modèles Fiables Et Conformes Aux Normes Du Secteur
Pré-Construits Pour Une Utilisation Rapide Et Efficace
Compatible MAC/PC, entièrement débloqué
Aucune Expertise N'Est Requise; Facile À Suivre
Bharat Petroleum Corporation Limited (BPCL.NS) Bundle
Évaluez les perspectives financières de Bharat Petroleum Corporation Limited (BPCLNS) comme un expert! Cette calculatrice DCF (BPCLNS) vous fournit des données financières pré-remplies et une flexibilité complète pour modifier la croissance des revenus, le WACC, les marges et d'autres hypothèses critiques pour s'aligner sur vos prévisions.
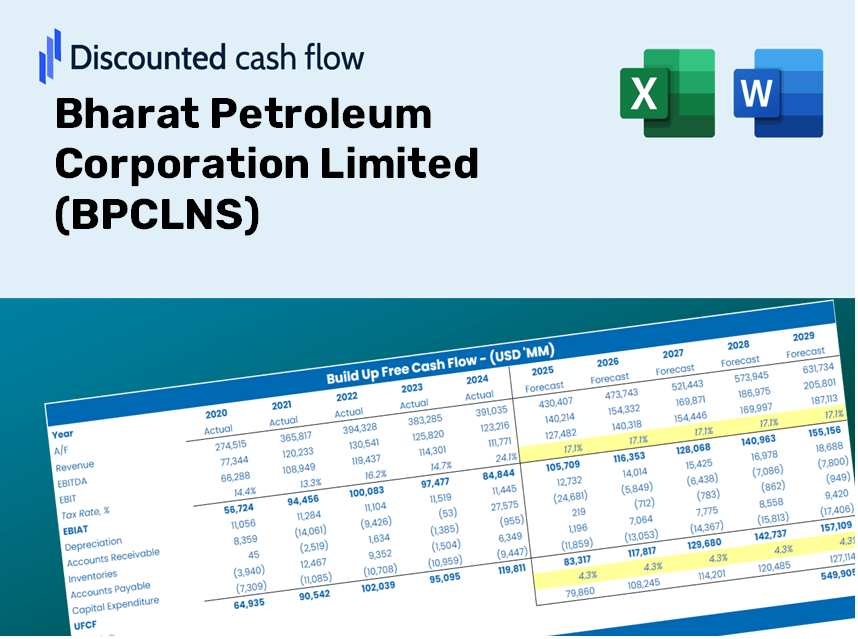
Discounted Cash Flow (DCF) - (USD MM)
| Year | AY1 2021 |
AY2 2022 |
AY3 2023 |
AY4 2024 |
AY5 2025 |
FY1 2026 |
FY2 2027 |
FY3 2028 |
FY4 2029 |
FY5 2030 |
|---|---|---|---|---|---|---|---|---|---|---|
| Revenue | 2,301,537.6 | 3,467,552.6 | 4,675,585.2 | 4,480,608.9 | 4,402,718.6 | 5,278,773.2 | 6,329,145.4 | 7,588,521.0 | 9,098,487.7 | 10,908,908.1 |
| Revenue Growth, % | 0 | 50.66 | 34.84 | -4.17 | -1.74 | 19.9 | 19.9 | 19.9 | 19.9 | 19.9 |
| EBITDA | 290,670.4 | 223,050.6 | 109,574.6 | 460,109.9 | 277,076.9 | 400,845.6 | 480,606.0 | 576,237.2 | 690,897.0 | 828,372.0 |
| EBITDA, % | 12.63 | 6.43 | 2.34 | 10.27 | 6.29 | 7.59 | 7.59 | 7.59 | 7.59 | 7.59 |
| Depreciation | 43,341.9 | 54,343.3 | 63,688.2 | 67,712.6 | 72,566.9 | 84,164.5 | 100,911.6 | 120,991.0 | 145,065.9 | 173,931.1 |
| Depreciation, % | 1.88 | 1.57 | 1.36 | 1.51 | 1.65 | 1.59 | 1.59 | 1.59 | 1.59 | 1.59 |
| EBIT | 247,328.5 | 168,707.3 | 45,886.4 | 392,397.3 | 204,510.0 | 316,681.1 | 379,694.4 | 455,246.1 | 545,831.2 | 654,440.9 |
| EBIT, % | 10.75 | 4.87 | 0.9814 | 8.76 | 4.65 | 6 | 6 | 6 | 6 | 6 |
| Total Cash | 149,043.8 | 66,013.1 | 68,515.9 | 102,664.1 | 141,386.6 | 162,033.2 | 194,274.6 | 232,931.4 | 279,280.2 | 334,851.5 |
| Total Cash, percent | .0 | .0 | .0 | .0 | .0 | .0 | .0 | .0 | .0 | .0 |
| Account Receivables | 80,440.2 | 111,624.1 | 74,661.9 | 83,420.3 | 118,886.7 | 135,908.6 | 162,951.7 | 195,375.9 | 234,251.9 | 280,863.4 |
| Account Receivables, % | 3.5 | 3.22 | 1.6 | 1.86 | 2.7 | 2.57 | 2.57 | 2.57 | 2.57 | 2.57 |
| Inventories | 267,060.2 | 421,787.4 | 380,691.9 | 428,361.3 | 452,651.9 | 546,364.0 | 655,079.7 | 785,427.7 | 941,712.4 | 1,129,094.7 |
| Inventories, % | 11.6 | 12.16 | 8.14 | 9.56 | 10.28 | 10.35 | 10.35 | 10.35 | 10.35 | 10.35 |
| Accounts Payable | 162,699.3 | 303,477.2 | 240,242.6 | 283,058.1 | 306,340.6 | 361,434.4 | 433,352.7 | 519,581.4 | 622,967.9 | 746,926.3 |
| Accounts Payable, % | 7.07 | 8.75 | 5.14 | 6.32 | 6.96 | 6.85 | 6.85 | 6.85 | 6.85 | 6.85 |
| Capital Expenditure | -92,059.2 | -77,506.3 | -85,486.2 | -95,791.3 | -151,431.2 | -144,013.8 | -172,669.7 | -207,027.6 | -248,222.1 | -297,613.4 |
| Capital Expenditure, % | -4 | -2.24 | -1.83 | -2.14 | -3.44 | -2.73 | -2.73 | -2.73 | -2.73 | -2.73 |
| Tax Rate, % | 26.65 | 26.65 | 26.65 | 26.65 | 26.65 | 26.65 | 26.65 | 26.65 | 26.65 | 26.65 |
| EBITAT | 178,230.1 | 122,890.0 | 34,662.1 | 291,186.6 | 150,006.2 | 233,076.8 | 279,454.5 | 335,060.5 | 401,731.0 | 481,667.5 |
| Depreciation | ||||||||||
| Changes in Account Receivables | ||||||||||
| Changes in Inventories | ||||||||||
| Changes in Accounts Payable | ||||||||||
| Capital Expenditure | ||||||||||
| UFCF | -55,288.3 | 54,593.8 | 27,687.2 | 249,495.6 | 34,667.4 | 117,587.3 | 143,855.9 | 172,480.4 | 206,800.6 | 247,949.9 |
| WACC, % | 7.09 | 7.1 | 7.15 | 7.13 | 7.11 | 7.12 | 7.12 | 7.12 | 7.12 | 7.12 |
| PV UFCF | ||||||||||
| SUM PV UFCF | 708,380.9 | |||||||||
| Long Term Growth Rate, % | 3.50 | |||||||||
| Free cash flow (T + 1) | 256,628 | |||||||||
| Terminal Value | 7,094,718 | |||||||||
| Present Terminal Value | 5,030,830 | |||||||||
| Enterprise Value | 5,739,211 | |||||||||
| Net Debt | 506,250 | |||||||||
| Equity Value | 5,232,961 | |||||||||
| Diluted Shares Outstanding, MM | 4,273 | |||||||||
| Equity Value Per Share | 1,224.61 |
What You Will Receive
- Authentic BPCL Data: Preloaded financial metrics – from revenue to EBIT – based on real and projected information.
- Comprehensive Customization: Modify all essential parameters (highlighted cells) such as WACC, growth rates, and tax percentages.
- Immediate Valuation Adjustments: Automatic recalculations to assess the effects of changes on BPCL's fair value.
- Flexible Excel Template: Designed for quick modifications, scenario analyses, and in-depth forecasts.
- Time-Efficient and Precise: Eliminate the need to build models from the ground up while ensuring accuracy and adaptability.
Key Features
- Customizable Forecast Variables: Adjust essential factors such as revenue growth, EBITDA margin, and capital expenditures.
- Instant DCF Valuation: Quickly computes intrinsic value, NPV, and other financial metrics.
- High-Precision Accuracy: Incorporates BPCL's real-world financial data for credible valuation results.
- Effortless Scenario Analysis: Evaluate various assumptions and easily compare results.
- Efficiency Booster: Remove the hassle of developing intricate valuation models from the ground up.
How It Functions
- Step 1: Download the Excel spreadsheet.
- Step 2: Review the pre-filled data for Bharat Petroleum Corporation Limited (BPCLNS) – both historical and forecasted.
- Step 3: Modify the key assumptions (highlighted in yellow) according to your insights.
- Step 4: Observe the automatic updates for the intrinsic value of Bharat Petroleum Corporation Limited (BPCLNS).
- Step 5: Utilize the results for your investment strategies or financial reporting.
Why Opt for This Calculator?
- Reliable Data: Access authentic Bharat Petroleum financials for trustworthy valuation outcomes.
- Flexible: Modify essential parameters such as growth rates, WACC, and tax rates to fit your forecasts.
- Efficient: Built-in calculations save you the hassle of starting from the beginning.
- Expert-Level Tool: Tailored for investors, analysts, and consultants in the industry.
- Easy to Use: User-friendly design and clear, step-by-step guidelines cater to all experience levels.
Who Should Use This Product?
- Investors: Accurately assess the fair value of Bharat Petroleum Corporation Limited (BPCLNS) prior to making investment choices.
- CFOs: Utilize a professional-grade DCF model for comprehensive financial reporting and analysis.
- Consultants: Effortlessly customize the template for valuation reports tailored to clients.
- Entrepreneurs: Acquire valuable insights into financial modeling practices employed by leading companies.
- Educators: Employ it as a teaching resource to illustrate various valuation methodologies.
Overview of the Template Contents
- Pre-Filled Data: Features Bharat Petroleum Corporation Limited’s (BPCLNS) historical financials and projections.
- Discounted Cash Flow Model: An editable DCF valuation model with automated calculations.
- Weighted Average Cost of Capital (WACC): A dedicated worksheet for computing WACC with customizable inputs.
- Essential Financial Ratios: Assess BPCLNS’s profitability, efficiency, and financial leverage.
- Customizable Inputs: Easily modify revenue growth rates, profit margins, and tax assumptions.
- User-Friendly Dashboard: Visuals and tables that summarize the primary valuation outcomes.
Disclaimer
All information, articles, and product details provided on this website are for general informational and educational purposes only. We do not claim any ownership over, nor do we intend to infringe upon, any trademarks, copyrights, logos, brand names, or other intellectual property mentioned or depicted on this site. Such intellectual property remains the property of its respective owners, and any references here are made solely for identification or informational purposes, without implying any affiliation, endorsement, or partnership.
We make no representations or warranties, express or implied, regarding the accuracy, completeness, or suitability of any content or products presented. Nothing on this website should be construed as legal, tax, investment, financial, medical, or other professional advice. In addition, no part of this site—including articles or product references—constitutes a solicitation, recommendation, endorsement, advertisement, or offer to buy or sell any securities, franchises, or other financial instruments, particularly in jurisdictions where such activity would be unlawful.
All content is of a general nature and may not address the specific circumstances of any individual or entity. It is not a substitute for professional advice or services. Any actions you take based on the information provided here are strictly at your own risk. You accept full responsibility for any decisions or outcomes arising from your use of this website and agree to release us from any liability in connection with your use of, or reliance upon, the content or products found herein.