
|
Brookfield Property Partners L.P. (BPYPO) Évaluation DCF |
Entièrement Modifiable: Adapté À Vos Besoins Dans Excel Ou Sheets
Conception Professionnelle: Modèles Fiables Et Conformes Aux Normes Du Secteur
Pré-Construits Pour Une Utilisation Rapide Et Efficace
Compatible MAC/PC, entièrement débloqué
Aucune Expertise N'Est Requise; Facile À Suivre
Brookfield Property Partners L.P. (BPYPO) Bundle
Conçu pour la précision, notre calculatrice DCF (BPYPO) vous permet d'évaluer l'évaluation des partenaires immobiliers de Brookfield L.P. à l'aide de données financières réelles, offrant une flexibilité complète pour modifier tous les paramètres clés pour des projections améliorées.
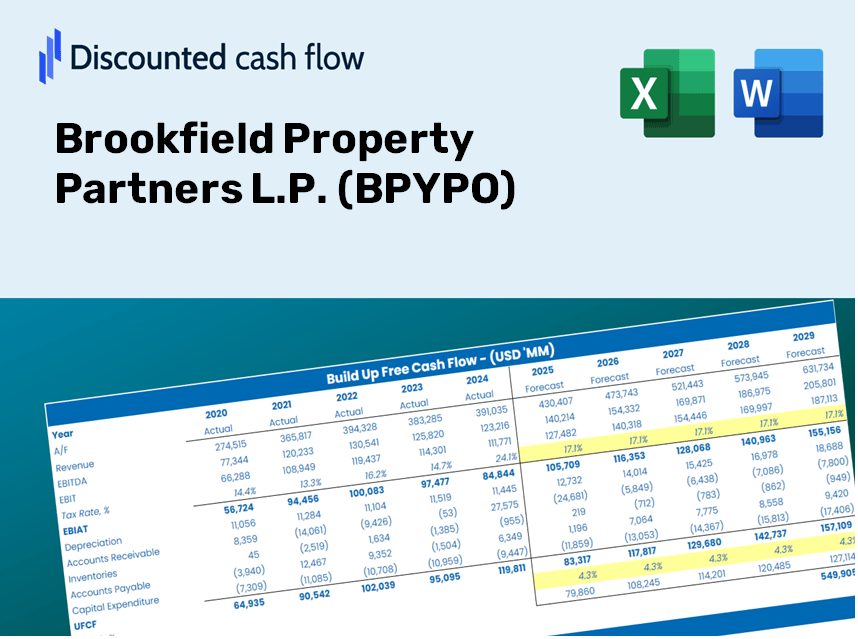
Discounted Cash Flow (DCF) - (USD MM)
| Year | AY1 2020 |
AY2 2021 |
AY3 2022 |
AY4 2023 |
AY5 2024 |
FY1 2025 |
FY2 2026 |
FY3 2027 |
FY4 2028 |
FY5 2029 |
|---|---|---|---|---|---|---|---|---|---|---|
| Revenue | 6,593.0 | 7,100.0 | 7,365.0 | 9,483.0 | 9,111.0 | 9,936.8 | 10,837.6 | 11,819.9 | 12,891.3 | 14,059.8 |
| Revenue Growth, % | 0 | 7.69 | 3.73 | 28.76 | -3.92 | 9.06 | 9.06 | 9.06 | 9.06 | 9.06 |
| EBITDA | 2,395.0 | 4,417.0 | 4,253.0 | 2,995.0 | 3,474.0 | 4,491.4 | 4,898.5 | 5,342.5 | 5,826.8 | 6,354.9 |
| EBITDA, % | 36.33 | 62.21 | 57.75 | 31.58 | 38.13 | 45.2 | 45.2 | 45.2 | 45.2 | 45.2 |
| Depreciation | 3,768.0 | 4,059.0 | 4,251.0 | 440.0 | 418.0 | 3,602.4 | 3,929.0 | 4,285.1 | 4,673.5 | 5,097.2 |
| Depreciation, % | 57.15 | 57.17 | 57.72 | 4.64 | 4.59 | 36.25 | 36.25 | 36.25 | 36.25 | 36.25 |
| EBIT | -1,373.0 | 358.0 | 2.0 | 2,555.0 | 3,056.0 | 888.9 | 969.5 | 1,057.4 | 1,153.2 | 1,257.8 |
| EBIT, % | -20.83 | 5.04 | 0.02715547 | 26.94 | 33.54 | 8.95 | 8.95 | 8.95 | 8.95 | 8.95 |
| Total Cash | 2,473.0 | 2,576.0 | 4,020.0 | 2,341.0 | 2,208.0 | 3,523.5 | 3,842.9 | 4,191.2 | 4,571.1 | 4,985.4 |
| Total Cash, percent | .0 | .0 | .0 | .0 | .0 | .0 | .0 | .0 | .0 | .0 |
| Account Receivables | 830.0 | 925.0 | 1,101.0 | 2,720.0 | 1,450.0 | 1,692.5 | 1,845.9 | 2,013.3 | 2,195.8 | 2,394.8 |
| Account Receivables, % | 12.59 | 13.03 | 14.95 | 28.68 | 15.91 | 17.03 | 17.03 | 17.03 | 17.03 | 17.03 |
| Inventories | 256.0 | 574.0 | 176.0 | .0 | 234.0 | 336.4 | 366.9 | 400.1 | 436.4 | 475.9 |
| Inventories, % | 3.88 | 8.08 | 2.39 | 0 | 2.57 | 3.39 | 3.39 | 3.39 | 3.39 | 3.39 |
| Accounts Payable | .0 | .0 | .0 | .0 | .0 | .0 | .0 | .0 | .0 | .0 |
| Accounts Payable, % | 0 | 0 | 0 | 0 | 0 | 0 | 0 | 0 | 0 | 0 |
| Capital Expenditure | -169.0 | -156.0 | -207.0 | -529.0 | -403.0 | -349.2 | -380.9 | -415.4 | -453.1 | -494.1 |
| Capital Expenditure, % | -2.56 | -2.2 | -2.81 | -5.58 | -4.42 | -3.51 | -3.51 | -3.51 | -3.51 | -3.51 |
| Tax Rate, % | 70.14 | 70.14 | 70.14 | 70.14 | 70.14 | 70.14 | 70.14 | 70.14 | 70.14 | 70.14 |
| EBITAT | -1,537.3 | 314.0 | 1.6 | 497.9 | 912.5 | 560.1 | 610.9 | 666.3 | 726.7 | 792.5 |
| Depreciation | ||||||||||
| Changes in Account Receivables | ||||||||||
| Changes in Inventories | ||||||||||
| Changes in Accounts Payable | ||||||||||
| Capital Expenditure | ||||||||||
| UFCF | 975.7 | 3,804.0 | 4,267.6 | -1,034.1 | 1,963.5 | 3,468.5 | 3,975.1 | 4,335.4 | 4,728.4 | 5,157.0 |
| WACC, % | 8.41 | 7.43 | 6.65 | 1.97 | 2.8 | 5.45 | 5.45 | 5.45 | 5.45 | 5.45 |
| PV UFCF | ||||||||||
| SUM PV UFCF | 18,339.2 | |||||||||
| Long Term Growth Rate, % | 2.00 | |||||||||
| Free cash flow (T + 1) | 5,260 | |||||||||
| Terminal Value | 152,354 | |||||||||
| Present Terminal Value | 116,833 | |||||||||
| Enterprise Value | 135,173 | |||||||||
| Net Debt | 52,077 | |||||||||
| Equity Value | 83,096 | |||||||||
| Diluted Shares Outstanding, MM | 351 | |||||||||
| Equity Value Per Share | 236.60 |
What You Will Receive
- Authentic Brookfield Data: Preloaded financial metrics – from revenue to EBIT – based on real and projected data.
- Complete Customization: Modify all key parameters (highlighted cells) such as WACC, growth %, and tax rates.
- Immediate Valuation Adjustments: Automatic updates to assess the impact of modifications on Brookfield's fair value.
- Flexible Excel Template: Designed for easy edits, scenario simulations, and comprehensive forecasts.
- Efficient and Precise: Eliminate the need to build models from scratch while ensuring accuracy and adaptability.
Key Features
- Comprehensive DCF Calculator: Features both unlevered and levered DCF valuation models tailored for Brookfield Property Partners L.P. (BPYPO).
- WACC Calculator: A pre-configured Weighted Average Cost of Capital spreadsheet with adjustable inputs for personalized analysis.
- Customizable Forecast Assumptions: Easily modify growth rates, capital expenditures, and discount rates to suit your analysis needs.
- Integrated Financial Ratios: Examine profitability, leverage, and efficiency ratios specific to Brookfield Property Partners L.P. (BPYPO).
- Interactive Dashboard and Charts: Visual representations of key valuation metrics for streamlined and effective analysis.
How It Works
- Step 1: Download the prebuilt Excel template with Brookfield Property Partners L.P. (BPYPO) data included.
- Step 2: Navigate through the pre-filled sheets to familiarize yourself with the essential metrics.
- Step 3: Modify the forecasts and assumptions in the editable yellow cells (WACC, growth, margins).
- Step 4: Instantly see the recalculated results, including Brookfield Property Partners L.P. (BPYPO)'s intrinsic value.
- Step 5: Utilize the outputs to make well-informed investment decisions or create detailed reports.
Why Choose Brookfield Property Partners L.P. (BPYPO) Calculator?
- Precision: Utilizes actual Brookfield financial data to ensure accuracy.
- Versatility: Crafted to allow users to freely test and adjust various inputs.
- Efficiency: Eliminate the complexity of creating a DCF model from the ground up.
- Expert-Level: Designed with the insight and usability expected by finance professionals.
- Intuitive: User-friendly interface suitable for individuals at all levels of financial expertise.
Who Can Benefit from BPYPO?
- Real Estate Investors: Enhance your investment strategies with a sophisticated valuation tool tailored for property analysis.
- Financial Analysts: Streamline your workflow using a customizable DCF model specifically designed for real estate evaluation.
- Consultants: Effortlessly modify the template for client presentations or comprehensive reports on property investments.
- Real Estate Enthusiasts: Expand your knowledge of valuation methods through practical, real-world case studies.
- Educators and Students: Utilize this resource as an effective educational tool in real estate finance courses.
Overview of the Template Features
- Pre-Filled Data: Contains Brookfield Property Partners L.P.'s historical financial information and projections.
- Discounted Cash Flow Model: Customizable DCF valuation model with automatic calculation functionality.
- Weighted Average Cost of Capital (WACC): A dedicated worksheet for WACC computation using tailored inputs.
- Key Financial Ratios: Assess BPYPO's profitability, operational efficiency, and financial leverage.
- Customizable Inputs: Easily modify revenue growth, profit margins, and tax rates.
- User-Friendly Dashboard: Visual representations and tables summarizing essential valuation outcomes.
Disclaimer
All information, articles, and product details provided on this website are for general informational and educational purposes only. We do not claim any ownership over, nor do we intend to infringe upon, any trademarks, copyrights, logos, brand names, or other intellectual property mentioned or depicted on this site. Such intellectual property remains the property of its respective owners, and any references here are made solely for identification or informational purposes, without implying any affiliation, endorsement, or partnership.
We make no representations or warranties, express or implied, regarding the accuracy, completeness, or suitability of any content or products presented. Nothing on this website should be construed as legal, tax, investment, financial, medical, or other professional advice. In addition, no part of this site—including articles or product references—constitutes a solicitation, recommendation, endorsement, advertisement, or offer to buy or sell any securities, franchises, or other financial instruments, particularly in jurisdictions where such activity would be unlawful.
All content is of a general nature and may not address the specific circumstances of any individual or entity. It is not a substitute for professional advice or services. Any actions you take based on the information provided here are strictly at your own risk. You accept full responsibility for any decisions or outcomes arising from your use of this website and agree to release us from any liability in connection with your use of, or reliance upon, the content or products found herein.