
|
Brederode SA (Breb.Br) Valation DCF |
Entièrement Modifiable: Adapté À Vos Besoins Dans Excel Ou Sheets
Conception Professionnelle: Modèles Fiables Et Conformes Aux Normes Du Secteur
Pré-Construits Pour Une Utilisation Rapide Et Efficace
Compatible MAC/PC, entièrement débloqué
Aucune Expertise N'Est Requise; Facile À Suivre
Brederode SA (BREB.BR) Bundle
Explorez les perspectives financières de Brederode SA (BREBBR) avec notre calculatrice DCF conviviale! Entrez vos hypothèses de croissance, de marges et de coûts pour calculer la valeur intrinsèque de Brederode SA (Brebbr) et affiner votre stratégie d'investissement.
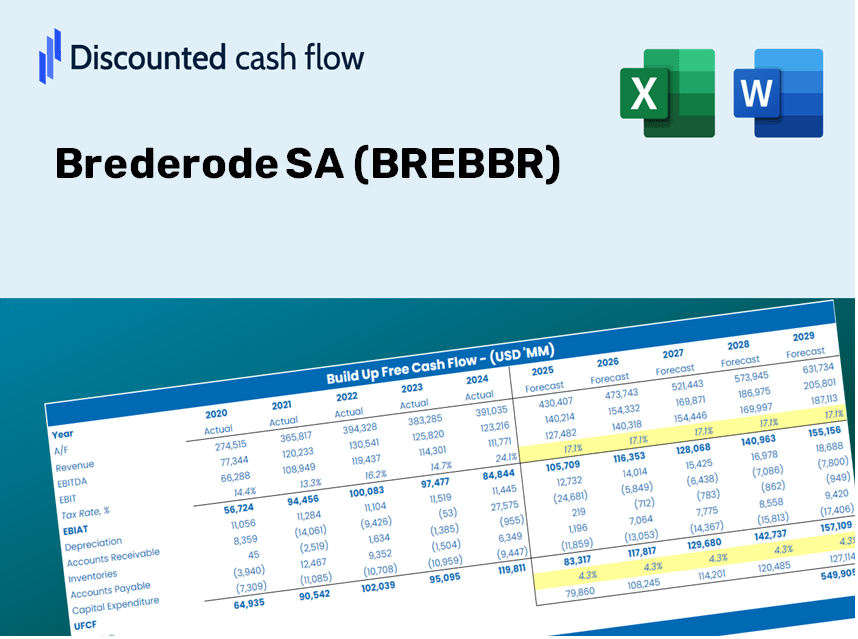
Discounted Cash Flow (DCF) - (USD MM)
| Year | AY1 2020 |
AY2 2021 |
AY3 2022 |
AY4 2023 |
AY5 2024 |
FY1 2025 |
FY2 2026 |
FY3 2027 |
FY4 2028 |
FY5 2029 |
|---|---|---|---|---|---|---|---|---|---|---|
| Revenue | 232.2 | 1,003.7 | 29.9 | 28.6 | 376.7 | 469.5 | 585.0 | 729.1 | 908.5 | 1,132.2 |
| Revenue Growth, % | 0 | 332.19 | -97.02 | -4.51 | 1219.08 | 24.62 | 24.62 | 24.62 | 24.62 | 24.62 |
| EBITDA | .0 | 1,035.6 | -73.3 | 233.7 | .0 | 93.9 | 117.0 | 145.8 | 181.7 | 226.4 |
| EBITDA, % | 0 | 103.18 | -245.07 | 818.17 | 0 | 20 | 20 | 20 | 20 | 20 |
| Depreciation | -262.0 | -1,035.6 | 73.3 | -233.7 | -413.3 | -281.7 | -351.0 | -437.4 | -545.1 | -679.3 |
| Depreciation, % | -112.83 | -103.18 | 245 | -818.28 | -109.7 | -60 | -60 | -60 | -60 | -60 |
| EBIT | 262.0 | 2,071.1 | -146.6 | 467.4 | 413.3 | 281.7 | 351.0 | 437.4 | 545.1 | 679.3 |
| EBIT, % | 112.83 | 206.35 | -490.07 | 1636.45 | 109.7 | 60 | 60 | 60 | 60 | 60 |
| Total Cash | .0 | .1 | .0 | .0 | .0 | .1 | .1 | .2 | .2 | .3 |
| Total Cash, percent | .0 | .0 | .0 | .0 | .0 | .0 | .0 | .0 | .0 | .0 |
| Account Receivables | .0 | .0 | .0 | .0 | .0 | .0 | .0 | .0 | .0 | .0 |
| Account Receivables, % | 0 | 0 | 0 | 0 | 0 | 0 | 0 | 0 | 0 | 0 |
| Inventories | .0 | .0 | .0 | .0 | .0 | .0 | .0 | .0 | .0 | .0 |
| Inventories, % | 0 | 0 | 0 | 0 | 0 | 0 | 0 | 0 | 0 | 0 |
| Accounts Payable | .0 | .0 | .0 | .0 | .0 | .0 | .0 | .0 | .0 | .0 |
| Accounts Payable, % | 0 | 0 | 0 | 0 | 0 | 0 | 0 | 0 | 0 | 0 |
| Capital Expenditure | .0 | .0 | .0 | .0 | .0 | .0 | .0 | .0 | .0 | .0 |
| Capital Expenditure, % | 0 | 0 | 0 | 0 | 0 | 0 | 0 | 0 | 0 | 0 |
| Tax Rate, % | 0 | 0 | 0 | 0 | 0 | 0 | 0 | 0 | 0 | 0 |
| EBITAT | 262.0 | 2,071.1 | -146.6 | 467.3 | 413.3 | 281.7 | 351.0 | 437.4 | 545.1 | 679.3 |
| Depreciation | ||||||||||
| Changes in Account Receivables | ||||||||||
| Changes in Inventories | ||||||||||
| Changes in Accounts Payable | ||||||||||
| Capital Expenditure | ||||||||||
| UFCF | .0 | 1,035.6 | -73.3 | 233.6 | .0 | .0 | .0 | .0 | .0 | .0 |
| WACC, % | 6.95 | 6.95 | 6.95 | 6.95 | 6.95 | 6.95 | 6.95 | 6.95 | 6.95 | 6.95 |
| PV UFCF | ||||||||||
| SUM PV UFCF | .0 | |||||||||
| Long Term Growth Rate, % | 2.00 | |||||||||
| Free cash flow (T + 1) | 0 | |||||||||
| Terminal Value | 0 | |||||||||
| Present Terminal Value | 0 | |||||||||
| Enterprise Value | 0 | |||||||||
| Net Debt | 0 | |||||||||
| Equity Value | 0 | |||||||||
| Diluted Shares Outstanding, MM | 29 | |||||||||
| Equity Value Per Share | 0.00 |
What You Will Receive
- Authentic Brederode Data: Preloaded financials – including revenue and EBIT – derived from actual and projected metrics.
- Comprehensive Customization: Modify all essential parameters (yellow cells) such as WACC, growth %, and tax rates.
- Instant Valuation Updates: Automatic recalculations to evaluate the effects of changes on Brederode’s fair value.
- Flexible Excel Template: Designed for quick modifications, scenario analysis, and in-depth projections.
- Efficient and Precise: Avoid starting models from scratch while ensuring accuracy and adaptability.
Highlighted Features
- Customizable Forecast Inputs: Adjust essential parameters such as revenue growth, EBITDA percentage, and capital expenditures.
- Instant DCF Valuation: Automatically computes intrinsic value, NPV, and other financial outputs within moments.
- High-Precision Accuracy: Leverages Brederode SA’s real-world financial data for dependable valuation results.
- Effortless Scenario Analysis: Easily experiment with different assumptions and analyze outcomes side by side.
- Efficiency Booster: Avoid the hassle of creating intricate valuation models from the ground up.
How It Operates
- Step 1: Download the ready-to-use Excel template featuring Brederode SA’s (BREBBR) data.
- Step 2: Review the pre-filled sheets to familiarize yourself with the essential metrics.
- Step 3: Modify forecasts and assumptions in the editable yellow cells (WACC, growth, margins).
- Step 4: Instantly see the updated results, including the intrinsic value of Brederode SA (BREBBR).
- Step 5: Utilize the outputs to make well-informed investment choices or create reports.
Why Opt for This Calculator?
- Precise Data: Utilize authentic Brederode SA (BREBBR) financials for trustworthy valuation outcomes.
- Personalizable: Modify essential variables such as growth rates, WACC, and tax rates to align with your forecasts.
- Efficient: Pre-configured calculations save you the effort of starting from the ground up.
- High-Quality Tool: Tailored for investors, analysts, and consultants alike.
- Easy to Use: A straightforward design and guided instructions ensure accessibility for all users.
Who Can Benefit from Brederode SA (BREBBR)?
- Investors: Assess the valuation of Brederode SA (BREBBR) prior to making investment decisions.
- CFOs and Financial Analysts: Optimize valuation methodologies and evaluate financial forecasts.
- Startup Founders: Gain insights into the valuation processes of established firms like Brederode SA (BREBBR).
- Consultants: Generate comprehensive valuation reports for your clientele.
- Students and Educators: Utilize practical data to explore and teach valuation strategies.
Contents of the Template
- Operating and Balance Sheet Data: Pre-filled historical data and projections for Brederode SA (BREBBR), covering aspects such as revenue, EBITDA, EBIT, and capital expenditures.
- WACC Calculation: A specific sheet dedicated to the Weighted Average Cost of Capital (WACC), featuring key parameters including Beta, risk-free rate, and share price.
- DCF Valuation (Unlevered and Levered): Editable Discounted Cash Flow models that calculate intrinsic value with comprehensive details.
- Financial Statements: Pre-loaded financial statements (annual and quarterly) to facilitate in-depth analysis.
- Key Ratios: Includes profitability, leverage, and efficiency ratios relevant to Brederode SA (BREBBR).
- Dashboard and Charts: Visual representation of valuation results and underlying assumptions for straightforward analysis.
Disclaimer
All information, articles, and product details provided on this website are for general informational and educational purposes only. We do not claim any ownership over, nor do we intend to infringe upon, any trademarks, copyrights, logos, brand names, or other intellectual property mentioned or depicted on this site. Such intellectual property remains the property of its respective owners, and any references here are made solely for identification or informational purposes, without implying any affiliation, endorsement, or partnership.
We make no representations or warranties, express or implied, regarding the accuracy, completeness, or suitability of any content or products presented. Nothing on this website should be construed as legal, tax, investment, financial, medical, or other professional advice. In addition, no part of this site—including articles or product references—constitutes a solicitation, recommendation, endorsement, advertisement, or offer to buy or sell any securities, franchises, or other financial instruments, particularly in jurisdictions where such activity would be unlawful.
All content is of a general nature and may not address the specific circumstances of any individual or entity. It is not a substitute for professional advice or services. Any actions you take based on the information provided here are strictly at your own risk. You accept full responsibility for any decisions or outcomes arising from your use of this website and agree to release us from any liability in connection with your use of, or reliance upon, the content or products found herein.