
|
Braze, Inc. (Brze) Valation DCF |
Entièrement Modifiable: Adapté À Vos Besoins Dans Excel Ou Sheets
Conception Professionnelle: Modèles Fiables Et Conformes Aux Normes Du Secteur
Pré-Construits Pour Une Utilisation Rapide Et Efficace
Compatible MAC/PC, entièrement débloqué
Aucune Expertise N'Est Requise; Facile À Suivre
Braze, Inc. (BRZE) Bundle
Explorez le potentiel financier de Braze, Inc. (BRZE) avec notre calculatrice DCF conviviale! Entrez vos hypothèses de croissance, de marges et de coûts pour calculer la valeur intrinsèque de Braze, Inc. (BRZE) et affiner votre stratégie d'investissement.
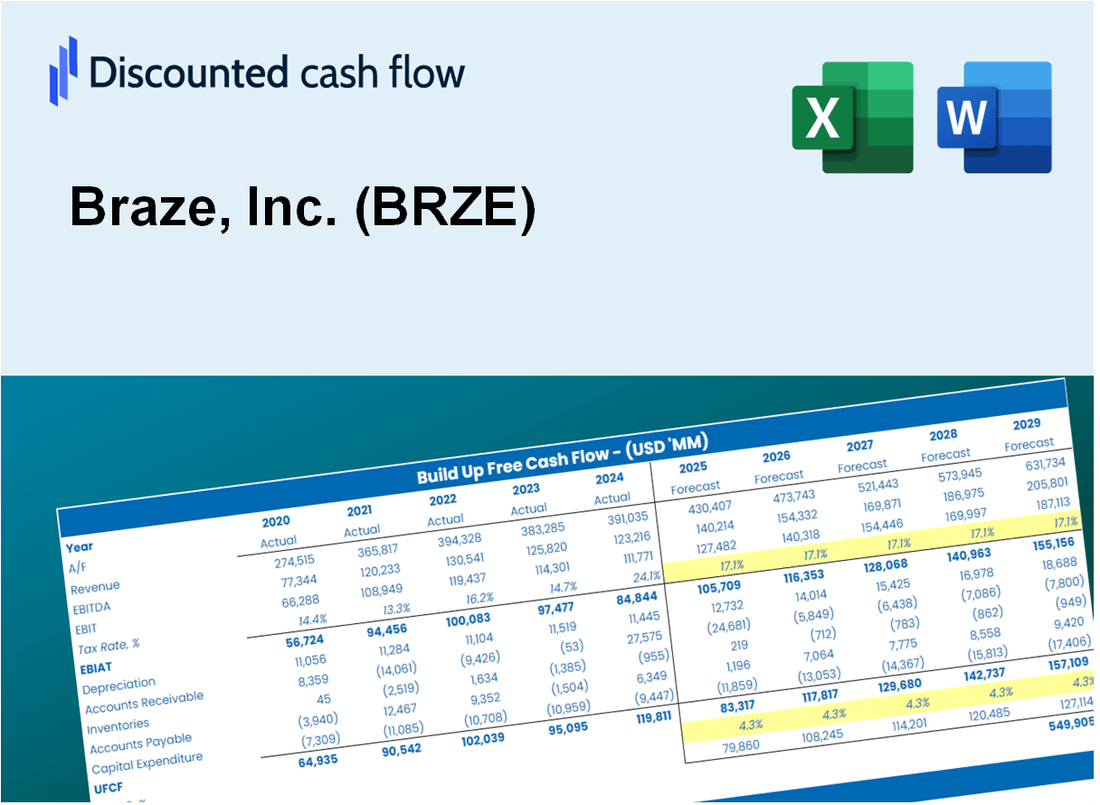
Discounted Cash Flow (DCF) - (USD MM)
| Year | AY1 2021 |
AY2 2022 |
AY3 2023 |
AY4 2024 |
AY5 2025 |
FY1 2026 |
FY2 2027 |
FY3 2028 |
FY4 2029 |
FY5 2030 |
|---|---|---|---|---|---|---|---|---|---|---|
| Revenue | 150.2 | 238.0 | 355.4 | 471.8 | 593.4 | 840.2 | 1,189.5 | 1,684.1 | 2,384.4 | 3,375.8 |
| Revenue Growth, % | 0 | 58.49 | 49.32 | 32.74 | 25.78 | 41.58 | 41.58 | 41.58 | 41.58 | 41.58 |
| EBITDA | -30.6 | -75.6 | -143.5 | -137.7 | -112.0 | -236.2 | -334.4 | -473.4 | -670.2 | -948.9 |
| EBITDA, % | -20.35 | -31.74 | -40.38 | -29.19 | -18.88 | -28.11 | -28.11 | -28.11 | -28.11 | -28.11 |
| Depreciation | 1.6 | 2.8 | 4.6 | 7.0 | 10.1 | 11.3 | 15.9 | 22.6 | 32.0 | 45.3 |
| Depreciation, % | 1.06 | 1.16 | 1.3 | 1.48 | 1.7 | 1.34 | 1.34 | 1.34 | 1.34 | 1.34 |
| EBIT | -32.2 | -78.3 | -148.1 | -144.7 | -122.2 | -247.4 | -350.3 | -496.0 | -702.2 | -994.2 |
| EBIT, % | -21.41 | -32.91 | -41.68 | -30.67 | -20.59 | -29.45 | -29.45 | -29.45 | -29.45 | -29.45 |
| Total Cash | 86.5 | 514.1 | 478.7 | 476.1 | 513.5 | 746.3 | 1,056.6 | 1,495.9 | 2,118.0 | 2,998.6 |
| Total Cash, percent | .0 | .0 | .0 | .0 | .0 | .0 | .0 | .0 | .0 | .0 |
| Account Receivables | 34.8 | 64.5 | 78.3 | 97.3 | 102.0 | 185.0 | 261.9 | 370.8 | 525.0 | 743.3 |
| Account Receivables, % | 23.15 | 27.1 | 22.04 | 20.62 | 17.18 | 22.02 | 22.02 | 22.02 | 22.02 | 22.02 |
| Inventories | 9.9 | 24.9 | .0 | .0 | .0 | 28.7 | 40.6 | 57.4 | 81.3 | 115.2 |
| Inventories, % | 6.6 | 10.46 | 0 | 0 | 0 | 3.41 | 3.41 | 3.41 | 3.41 | 3.41 |
| Accounts Payable | .4 | 2.1 | 3.1 | 6.3 | 2.2 | 6.3 | 8.9 | 12.6 | 17.8 | 25.3 |
| Accounts Payable, % | 0.29229 | 0.87508 | 0.87247 | 1.34 | 0.36231 | 0.74839 | 0.74839 | 0.74839 | 0.74839 | 0.74839 |
| Capital Expenditure | -4.4 | -4.4 | -16.7 | -9.8 | -13.2 | -23.1 | -32.7 | -46.3 | -65.5 | -92.7 |
| Capital Expenditure, % | -2.9 | -1.84 | -4.7 | -2.07 | -2.23 | -2.75 | -2.75 | -2.75 | -2.75 | -2.75 |
| Tax Rate, % | -3.12 | -3.12 | -3.12 | -3.12 | -3.12 | -3.12 | -3.12 | -3.12 | -3.12 | -3.12 |
| EBITAT | -32.7 | -78.2 | -148.8 | -145.5 | -126.0 | -247.3 | -350.2 | -495.8 | -701.9 | -993.7 |
| Depreciation | ||||||||||
| Changes in Account Receivables | ||||||||||
| Changes in Inventories | ||||||||||
| Changes in Accounts Payable | ||||||||||
| Capital Expenditure | ||||||||||
| UFCF | -79.7 | -122.9 | -148.8 | -164.0 | -137.9 | -366.7 | -453.1 | -641.5 | -908.3 | -1,285.9 |
| WACC, % | 8.63 | 8.63 | 8.63 | 8.63 | 8.63 | 8.63 | 8.63 | 8.63 | 8.63 | 8.63 |
| PV UFCF | ||||||||||
| SUM PV UFCF | -2,724.2 | |||||||||
| Long Term Growth Rate, % | 2.00 | |||||||||
| Free cash flow (T + 1) | -1,312 | |||||||||
| Terminal Value | -19,780 | |||||||||
| Present Terminal Value | -13,076 | |||||||||
| Enterprise Value | -15,800 | |||||||||
| Net Debt | 4 | |||||||||
| Equity Value | -15,804 | |||||||||
| Diluted Shares Outstanding, MM | 102 | |||||||||
| Equity Value Per Share | -154.66 |
What You Will Get
- Comprehensive BRZE Financial Data: Pre-filled with Braze, Inc.’s historical and projected data for accurate analysis.
- Fully Customizable Template: Easily adjust key inputs such as revenue growth, WACC, and EBITDA %.
- Instant Calculations: Watch Braze, Inc.’s intrinsic value update in real-time as you make changes.
- Professional Valuation Tool: Tailored for investors, analysts, and consultants aiming for precise DCF outcomes.
- User-Centric Design: Intuitive layout and clear guidance suitable for all skill levels.
Key Features
- Comprehensive Braze Insights: Gain access to detailed pre-loaded historical performance data and future growth forecasts.
- Adjustable Projection Parameters: Modify highlighted cells for metrics such as customer acquisition cost, retention rates, and revenue growth.
- Real-time Analytics: Instant updates to key performance indicators, customer lifetime value (CLV), and engagement metrics.
- Interactive Dashboard: User-friendly graphs and summaries to help you interpret your analysis of Braze's performance.
- Suitable for All Skill Levels: An accessible, straightforward layout designed for marketers, analysts, and business leaders.
How It Works
- 1. Access the Template: Download and open the Excel file containing Braze, Inc.'s (BRZE) preloaded data.
- 2. Adjust Assumptions: Modify key inputs such as growth rates, WACC, and capital expenditures.
- 3. View Results Instantly: The DCF model automatically calculates intrinsic value and NPV.
- 4. Explore Scenarios: Analyze various forecasts to evaluate different valuation outcomes.
- 5. Present with Assurance: Deliver professional valuation insights to bolster your decision-making.
Why Choose This Calculator?
- User-Friendly Interface: Perfect for both novices and seasoned professionals.
- Customizable Inputs: Adjust parameters easily to suit your specific analysis needs.
- Real-Time Feedback: Observe immediate updates to Braze, Inc.’s (BRZE) valuation as you change inputs.
- Preloaded Data: Comes equipped with Braze, Inc.’s (BRZE) latest financial information for swift evaluations.
- Preferred by Experts: Trusted by investors and analysts for making well-informed choices.
Who Should Use This Product?
- Investors: Effectively assess Braze, Inc.’s (BRZE) intrinsic value prior to making investment choices.
- CFOs: Utilize a top-tier DCF model for accurate financial reporting and comprehensive analysis.
- Consultants: Easily customize the template for client valuation reports.
- Entrepreneurs: Acquire knowledge on financial modeling techniques employed by leading tech companies.
- Educators: Implement it as a resource to illustrate various valuation methodologies.
What the Template Contains
- Pre-Filled Data: Includes Braze, Inc.'s (BRZE) historical financials and forecasts.
- Discounted Cash Flow Model: Editable DCF valuation model with automatic calculations.
- Weighted Average Cost of Capital (WACC): A dedicated sheet for calculating WACC based on custom inputs.
- Key Financial Ratios: Analyze Braze, Inc.'s (BRZE) profitability, efficiency, and leverage.
- Customizable Inputs: Edit revenue growth, margins, and tax rates with ease.
- Clear Dashboard: Charts and tables summarizing key valuation results.
Disclaimer
All information, articles, and product details provided on this website are for general informational and educational purposes only. We do not claim any ownership over, nor do we intend to infringe upon, any trademarks, copyrights, logos, brand names, or other intellectual property mentioned or depicted on this site. Such intellectual property remains the property of its respective owners, and any references here are made solely for identification or informational purposes, without implying any affiliation, endorsement, or partnership.
We make no representations or warranties, express or implied, regarding the accuracy, completeness, or suitability of any content or products presented. Nothing on this website should be construed as legal, tax, investment, financial, medical, or other professional advice. In addition, no part of this site—including articles or product references—constitutes a solicitation, recommendation, endorsement, advertisement, or offer to buy or sell any securities, franchises, or other financial instruments, particularly in jurisdictions where such activity would be unlawful.
All content is of a general nature and may not address the specific circumstances of any individual or entity. It is not a substitute for professional advice or services. Any actions you take based on the information provided here are strictly at your own risk. You accept full responsibility for any decisions or outcomes arising from your use of this website and agree to release us from any liability in connection with your use of, or reliance upon, the content or products found herein.