
|
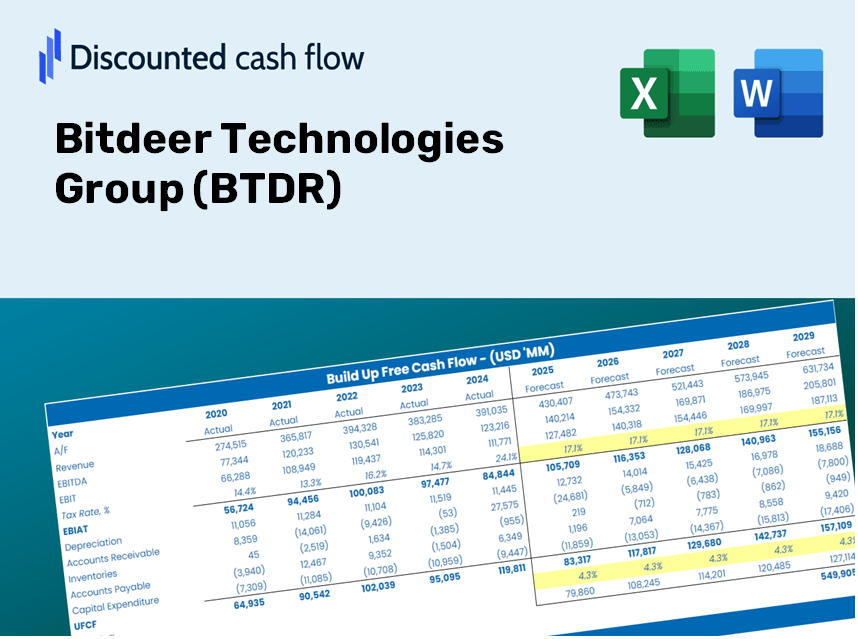
Bitdeer Technologies Group (BTDR) Évaluation DCF |
Entièrement Modifiable: Adapté À Vos Besoins Dans Excel Ou Sheets
Conception Professionnelle: Modèles Fiables Et Conformes Aux Normes Du Secteur
Pré-Construits Pour Une Utilisation Rapide Et Efficace
Compatible MAC/PC, entièrement débloqué
Aucune Expertise N'Est Requise; Facile À Suivre
Bitdeer Technologies Group (BTDR) Bundle
Évaluez les perspectives financières du groupe Bitdeer Technologies (BTDR) comme un expert! Cette calculatrice DCF (BTDR) est livrée avec des données financières pré-remplies et offre une pleine flexibilité pour modifier la croissance des revenus, le WACC, les marges et d'autres hypothèses essentielles pour s'aligner sur vos projections.
Benefits You Will Receive
- Flexible Forecast Variables: Modify key inputs (growth %, margins, WACC) effortlessly to explore various scenarios.
- Real-Time Data: Access Bitdeer Technologies Group's (BTDR) financial information pre-populated for your convenience.
- Instant DCF Calculations: The template automatically computes Net Present Value (NPV) and intrinsic value for you.
- Professional and Adaptable: A refined Excel model designed to meet your valuation requirements.
- Tailored for Analysts and Investors: Perfect for evaluating forecasts, confirming strategies, and optimizing efficiency.
Key Features
- Customizable Forecast Inputs: Adjust essential parameters such as revenue growth, EBITDA %, and capital expenditures tailored to Bitdeer Technologies Group (BTDR).
- Instant DCF Valuation: Quickly computes intrinsic value, NPV, and other relevant outputs for Bitdeer Technologies Group (BTDR).
- High-Precision Accuracy: Utilizes Bitdeer Technologies Group (BTDR)'s actual financial data for reliable valuation results.
- Seamless Scenario Analysis: Effortlessly explore various assumptions and evaluate the results for Bitdeer Technologies Group (BTDR).
- Efficiency Booster: Remove the hassle of constructing intricate valuation models from the ground up for Bitdeer Technologies Group (BTDR).
How It Functions
- Download: Get the pre-prepared Excel file containing Bitdeer Technologies Group’s financial data.
- Customize: Modify projections, such as revenue growth, EBITDA %, and WACC.
- Update Automatically: The calculations for intrinsic value and NPV refresh in real-time.
- Test Scenarios: Develop various projections and analyze results instantly.
- Make Decisions: Leverage the valuation outcomes to inform your investment approach for Bitdeer Technologies Group (BTDR).
Why Opt for This Calculator?
- Designed for Industry Experts: A sophisticated tool tailored for analysts, CFOs, and consultants.
- Accurate Data Insights: Bitdeer Technologies Group’s historical and projected financials are integrated for precision.
- Flexible Scenario Analysis: Effortlessly test various forecasts and assumptions.
- Transparent Results: Instantly computes intrinsic value, NPV, and essential metrics.
- User-Friendly: Comprehensive, step-by-step guidance leads you through every stage.
Who Can Benefit from Bitdeer Technologies Group (BTDR)?
- Investors: Make informed decisions with a robust valuation tool tailored for the cryptocurrency sector.
- Financial Analysts: Streamline your analysis with a versatile DCF model designed for easy customization.
- Consultants: Effortlessly modify the template for impactful client presentations and reports.
- Blockchain Enthusiasts: Enhance your knowledge of valuation methods through practical, real-world case studies.
- Educators and Students: Utilize this resource as a hands-on learning tool in blockchain and finance courses.
Contents of the Template
- Pre-Filled DCF Model: Bitdeer Technologies Group’s financial data preloaded for immediate analysis.
- WACC Calculator: Comprehensive calculations for the Weighted Average Cost of Capital.
- Financial Ratios: Assess Bitdeer Technologies Group’s profitability, leverage, and operational efficiency.
- Editable Inputs: Modify assumptions such as growth rates, margins, and CAPEX to tailor your scenarios.
- Financial Statements: Access annual and quarterly reports for in-depth analysis.
- Interactive Dashboard: Effortlessly visualize essential valuation metrics and outcomes.
Disclaimer
All information, articles, and product details provided on this website are for general informational and educational purposes only. We do not claim any ownership over, nor do we intend to infringe upon, any trademarks, copyrights, logos, brand names, or other intellectual property mentioned or depicted on this site. Such intellectual property remains the property of its respective owners, and any references here are made solely for identification or informational purposes, without implying any affiliation, endorsement, or partnership.
We make no representations or warranties, express or implied, regarding the accuracy, completeness, or suitability of any content or products presented. Nothing on this website should be construed as legal, tax, investment, financial, medical, or other professional advice. In addition, no part of this site—including articles or product references—constitutes a solicitation, recommendation, endorsement, advertisement, or offer to buy or sell any securities, franchises, or other financial instruments, particularly in jurisdictions where such activity would be unlawful.
All content is of a general nature and may not address the specific circumstances of any individual or entity. It is not a substitute for professional advice or services. Any actions you take based on the information provided here are strictly at your own risk. You accept full responsibility for any decisions or outcomes arising from your use of this website and agree to release us from any liability in connection with your use of, or reliance upon, the content or products found herein.