
|
Bureau Veritas SA (BVI.PA) Évaluation DCF |
Entièrement Modifiable: Adapté À Vos Besoins Dans Excel Ou Sheets
Conception Professionnelle: Modèles Fiables Et Conformes Aux Normes Du Secteur
Pré-Construits Pour Une Utilisation Rapide Et Efficace
Compatible MAC/PC, entièrement débloqué
Aucune Expertise N'Est Requise; Facile À Suivre
Bureau Veritas SA (BVI.PA) Bundle
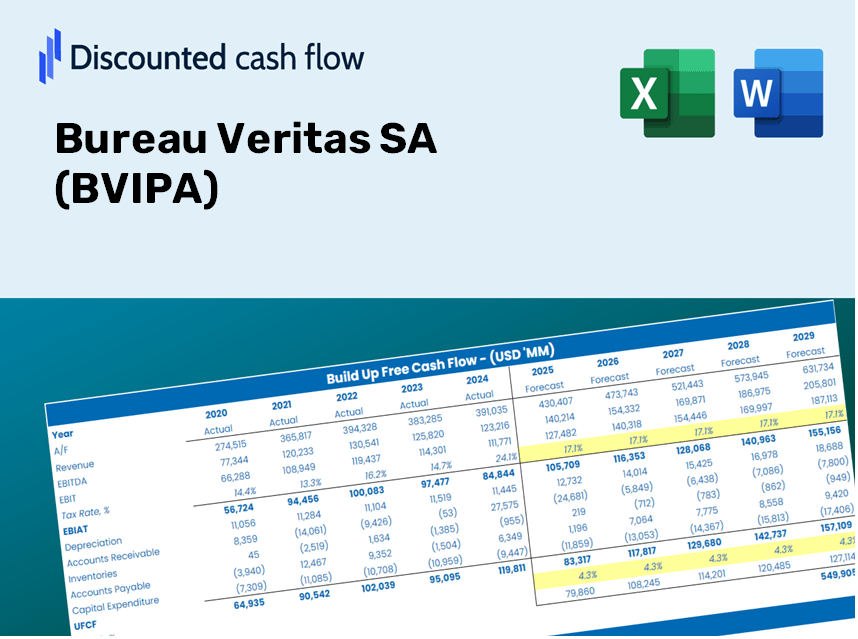
Vous cherchez à déterminer la valeur intrinsèque du Bureau Veritas SA? Notre calculatrice (BVIPA) DCF intègre des données réelles avec des fonctionnalités de personnalisation approfondies, vous permettant d'affiner vos prévisions et d'améliorer vos choix d'investissement.
Discounted Cash Flow (DCF) - (USD MM)
| Year | AY1 2020 |
AY2 2021 |
AY3 2022 |
AY4 2023 |
AY5 2024 |
FY1 2025 |
FY2 2026 |
FY3 2027 |
FY4 2028 |
FY5 2029 |
|---|---|---|---|---|---|---|---|---|---|---|
| Revenue | 4,601.0 | 4,981.1 | 5,650.6 | 5,867.8 | 6,240.9 | 6,259.6 | 6,278.3 | 6,297.1 | 6,315.9 | 6,334.8 |
| Revenue Growth, % | 0 | 8.26 | 13.44 | 3.84 | 6.36 | 0.29907 | 0.29907 | 0.29907 | 0.29907 | 0.29907 |
| EBITDA | 747.4 | 1,006.2 | 1,110.1 | 1,159.0 | 1,247.8 | 1,199.8 | 1,203.4 | 1,207.0 | 1,210.6 | 1,214.2 |
| EBITDA, % | 16.24 | 20.2 | 19.65 | 19.75 | 19.99 | 19.17 | 19.17 | 19.17 | 19.17 | 19.17 |
| Depreciation | 362.9 | 275.2 | 297.1 | 291.5 | 283.7 | 352.8 | 353.9 | 354.9 | 356.0 | 357.1 |
| Depreciation, % | 7.89 | 5.52 | 5.26 | 4.97 | 4.55 | 5.64 | 5.64 | 5.64 | 5.64 | 5.64 |
| EBIT | 384.5 | 731.0 | 813.0 | 867.5 | 964.1 | 846.9 | 849.5 | 852.0 | 854.6 | 857.1 |
| EBIT, % | 8.36 | 14.68 | 14.39 | 14.78 | 15.45 | 13.53 | 13.53 | 13.53 | 13.53 | 13.53 |
| Total Cash | 1,595.6 | 1,423.2 | 1,663.2 | 1,175.1 | 1,215.5 | 1,654.9 | 1,659.8 | 1,664.8 | 1,669.8 | 1,674.8 |
| Total Cash, percent | .0 | .0 | .0 | .0 | .0 | .0 | .0 | .0 | .0 | .0 |
| Account Receivables | 1,281.1 | 1,498.0 | 1,568.5 | .0 | 1,954.6 | 1,464.7 | 1,469.1 | 1,473.4 | 1,477.9 | 1,482.3 |
| Account Receivables, % | 27.84 | 30.07 | 27.76 | 0 | 31.32 | 23.4 | 23.4 | 23.4 | 23.4 | 23.4 |
| Inventories | 41.8 | 57.6 | 54.7 | 49.3 | .0 | 48.5 | 48.6 | 48.8 | 48.9 | 49.1 |
| Inventories, % | 0.9085 | 1.16 | 0.96804 | 0.84018 | 0 | 0.77462 | 0.77462 | 0.77462 | 0.77462 | 0.77462 |
| Accounts Payable | 453.2 | 532.3 | 557.6 | 520.6 | 1,392.5 | 771.0 | 773.3 | 775.7 | 778.0 | 780.3 |
| Accounts Payable, % | 9.85 | 10.69 | 9.87 | 8.87 | 22.31 | 12.32 | 12.32 | 12.32 | 12.32 | 12.32 |
| Capital Expenditure | -98.4 | -121.0 | -130.1 | -157.6 | -145.9 | -148.9 | -149.3 | -149.8 | -150.2 | -150.7 |
| Capital Expenditure, % | -2.14 | -2.43 | -2.3 | -2.69 | -2.34 | -2.38 | -2.38 | -2.38 | -2.38 | -2.38 |
| Tax Rate, % | 34.02 | 34.02 | 34.02 | 34.02 | 34.02 | 34.02 | 34.02 | 34.02 | 34.02 | 34.02 |
| EBITAT | 180.2 | 476.7 | 528.5 | 577.5 | 636.1 | 524.5 | 526.0 | 527.6 | 529.2 | 530.8 |
| Depreciation | ||||||||||
| Changes in Account Receivables | ||||||||||
| Changes in Inventories | ||||||||||
| Changes in Accounts Payable | ||||||||||
| Capital Expenditure | ||||||||||
| UFCF | -425.0 | 477.3 | 653.2 | 2,248.3 | -259.5 | 548.4 | 728.4 | 730.5 | 732.7 | 734.9 |
| WACC, % | 6.12 | 6.26 | 6.26 | 6.27 | 6.27 | 6.24 | 6.24 | 6.24 | 6.24 | 6.24 |
| PV UFCF | ||||||||||
| SUM PV UFCF | 2,889.0 | |||||||||
| Long Term Growth Rate, % | 2.00 | |||||||||
| Free cash flow (T + 1) | 750 | |||||||||
| Terminal Value | 17,687 | |||||||||
| Present Terminal Value | 13,069 | |||||||||
| Enterprise Value | 15,958 | |||||||||
| Net Debt | 1,669 | |||||||||
| Equity Value | 14,289 | |||||||||
| Diluted Shares Outstanding, MM | 454 | |||||||||
| Equity Value Per Share | 31.48 |
Benefits You'll Receive
- Pre-Filled Financial Model: Bureau Veritas SA's actual data allows for accurate DCF valuation.
- Comprehensive Forecast Control: Easily modify revenue growth, profit margins, WACC, and other essential factors.
- Real-Time Calculations: Automatic updates provide immediate feedback as you adjust inputs.
- Investor-Ready Template: A polished Excel file tailored for high-quality valuation assessments.
- Customizable and Reusable: Designed for versatility, enabling repeated application for in-depth forecasts.
Key Features
- Real-Time BVIPA Data: Pre-loaded with Bureau Veritas' historical financial records and forward-looking estimates.
- Completely Customizable Inputs: Modify revenue growth rates, profit margins, WACC, tax percentages, and capital investments.
- Interactive Valuation Model: Instantaneous adjustments to Net Present Value (NPV) and intrinsic value based on your entered data.
- Scenario Analysis: Develop various forecast scenarios to explore different valuation results.
- Intuitive Design: Clear, organized layout suitable for both professionals and novices.
How It Works
- Step 1: Download the Excel file.
- Step 2: Examine the pre-filled Bureau Veritas SA (BVIPA) data (both historical and forecasts).
- Step 3: Modify the key assumptions (highlighted in yellow) based on your findings.
- Step 4: Observe the automatic updates for the intrinsic value of Bureau Veritas SA (BVIPA).
- Step 5: Utilize the results for your investment strategies or reporting purposes.
Why Opt for This Bureau Veritas Calculator?
- Precision: Utilizes authentic Bureau Veritas financial data to ensure accurate results.
- Versatility: Built for users to effortlessly test and adjust parameters.
- Efficiency: Avoid the complexities of creating a DCF model from the ground up.
- Expert-Level: Crafted with the expertise and usability that meet CFO standards.
- Accessible: Simple to navigate, making it suitable for users without extensive financial modeling skills.
Who Should Utilize This Product?
- Institutional Investors: Develop comprehensive and dependable valuation models for portfolio assessments involving Bureau Veritas SA (BVIPA).
- Corporate Finance Departments: Evaluate valuation scenarios to inform strategic decisions within the organization.
- Consultants and Financial Advisors: Deliver precise valuation insights for clients interested in Bureau Veritas SA (BVIPA).
- Students and Instructors: Leverage real-life data to enhance learning and practice in financial modeling.
- Industry Analysts: Gain insights into how companies like Bureau Veritas SA (BVIPA) are valued in the marketplace.
What the Template Includes
- Preloaded BVIPA Data: Historical and projected financial information, encompassing revenue, EBIT, and capital expenditures.
- DCF and WACC Models: High-quality spreadsheets for determining intrinsic value and Weighted Average Cost of Capital.
- Editable Inputs: Yellow-highlighted fields for modifying revenue growth, tax rates, and discount rates.
- Financial Statements: Detailed annual and quarterly financials for in-depth analysis.
- Key Ratios: Metrics for profitability, leverage, and efficiency to assess overall performance.
- Dashboard and Charts: Visual representations of valuation results and underlying assumptions.
Disclaimer
All information, articles, and product details provided on this website are for general informational and educational purposes only. We do not claim any ownership over, nor do we intend to infringe upon, any trademarks, copyrights, logos, brand names, or other intellectual property mentioned or depicted on this site. Such intellectual property remains the property of its respective owners, and any references here are made solely for identification or informational purposes, without implying any affiliation, endorsement, or partnership.
We make no representations or warranties, express or implied, regarding the accuracy, completeness, or suitability of any content or products presented. Nothing on this website should be construed as legal, tax, investment, financial, medical, or other professional advice. In addition, no part of this site—including articles or product references—constitutes a solicitation, recommendation, endorsement, advertisement, or offer to buy or sell any securities, franchises, or other financial instruments, particularly in jurisdictions where such activity would be unlawful.
All content is of a general nature and may not address the specific circumstances of any individual or entity. It is not a substitute for professional advice or services. Any actions you take based on the information provided here are strictly at your own risk. You accept full responsibility for any decisions or outcomes arising from your use of this website and agree to release us from any liability in connection with your use of, or reliance upon, the content or products found herein.