
|
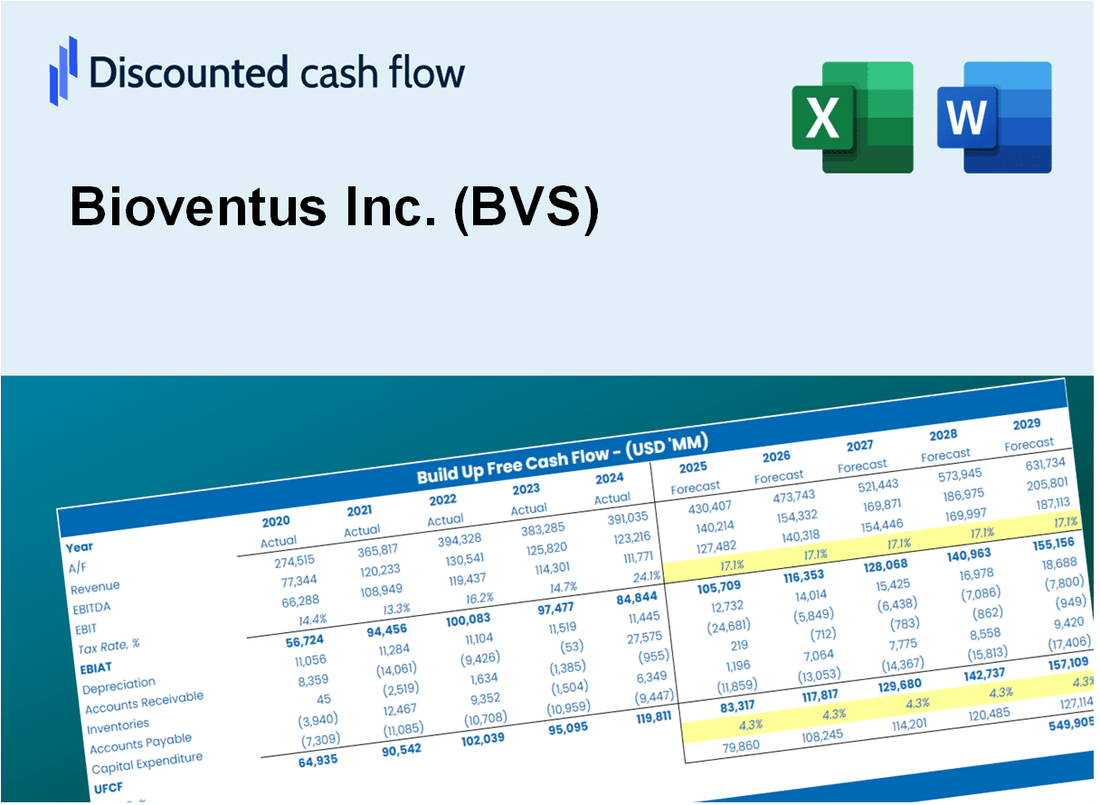
Bioventus Inc. (BVS) Valeure DCF |
Entièrement Modifiable: Adapté À Vos Besoins Dans Excel Ou Sheets
Conception Professionnelle: Modèles Fiables Et Conformes Aux Normes Du Secteur
Pré-Construits Pour Une Utilisation Rapide Et Efficace
Compatible MAC/PC, entièrement débloqué
Aucune Expertise N'Est Requise; Facile À Suivre
Bioventus Inc. (BVS) Bundle
Vous cherchez à déterminer la valeur intrinsèque de Bioventus Inc.? Notre calculatrice BVS DCF intègre des données réelles avec des fonctionnalités de personnalisation complètes, vous permettant d'affiner vos prévisions et d'améliorer vos stratégies d'investissement.
What You Will Get
- Editable Forecast Inputs: Easily modify assumptions (growth %, margins, WACC) to explore various scenarios.
- Real-World Data: Bioventus Inc.’s (BVS) financial data pre-filled to streamline your analysis.
- Automatic DCF Outputs: The template computes Net Present Value (NPV) and intrinsic value for you.
- Customizable and Professional: A refined Excel model tailored to meet your valuation requirements.
- Built for Analysts and Investors: Perfect for evaluating projections, confirming strategies, and enhancing efficiency.
Key Features
- 🔍 Real-Life BVS Financials: Pre-filled historical and projected data for Bioventus Inc.
- ✏️ Fully Customizable Inputs: Adjust all critical parameters (yellow cells) like WACC, growth %, and tax rates.
- 📊 Professional DCF Valuation: Built-in formulas calculate Bioventus’s intrinsic value using the Discounted Cash Flow method.
- ⚡ Instant Results: Visualize Bioventus’s valuation instantly after making changes.
- Scenario Analysis: Test and compare outcomes for various financial assumptions side-by-side.
How It Works
- Step 1: Download the Excel file.
- Step 2: Review pre-entered Bioventus Inc. (BVS) data (historical and projected).
- Step 3: Adjust key assumptions (yellow cells) based on your analysis.
- Step 4: View automatic recalculations for Bioventus Inc. (BVS)’s intrinsic value.
- Step 5: Use the outputs for investment decisions or reporting.
Why Choose Bioventus Inc. (BVS)?
- Innovative Solutions: Benefit from cutting-edge technologies in regenerative medicine.
- Proven Efficacy: Our products are backed by extensive clinical research and positive outcomes.
- Patient-Centric Approach: Focused on improving patient quality of life through advanced therapies.
- Expert Support: Access to a dedicated team of professionals for guidance and assistance.
- Commitment to Excellence: We prioritize quality and compliance in all our offerings.
Who Should Use This Product?
- Individual Investors: Gain insights to make informed decisions regarding Bioventus Inc. (BVS) stock transactions.
- Financial Analysts: Enhance valuation methodologies with accessible financial models tailored for Bioventus Inc. (BVS).
- Consultants: Provide clients with accurate and timely valuation assessments related to Bioventus Inc. (BVS).
- Business Owners: Learn from the valuation strategies of Bioventus Inc. (BVS) to inform your own business decisions.
- Finance Students: Explore real-world valuation techniques using Bioventus Inc. (BVS) data and case studies.
What the Template Contains
- Pre-Filled Data: Includes Bioventus Inc.'s (BVS) historical financials and projections.
- Discounted Cash Flow Model: Editable DCF valuation model with automatic calculations tailored for Bioventus Inc. (BVS).
- Weighted Average Cost of Capital (WACC): A dedicated sheet for calculating WACC based on custom inputs specific to Bioventus Inc. (BVS).
- Key Financial Ratios: Analyze Bioventus Inc.'s (BVS) profitability, efficiency, and leverage.
- Customizable Inputs: Edit revenue growth, margins, and tax rates with ease for Bioventus Inc. (BVS).
- Clear Dashboard: Charts and tables summarizing key valuation results for Bioventus Inc. (BVS).
Disclaimer
All information, articles, and product details provided on this website are for general informational and educational purposes only. We do not claim any ownership over, nor do we intend to infringe upon, any trademarks, copyrights, logos, brand names, or other intellectual property mentioned or depicted on this site. Such intellectual property remains the property of its respective owners, and any references here are made solely for identification or informational purposes, without implying any affiliation, endorsement, or partnership.
We make no representations or warranties, express or implied, regarding the accuracy, completeness, or suitability of any content or products presented. Nothing on this website should be construed as legal, tax, investment, financial, medical, or other professional advice. In addition, no part of this site—including articles or product references—constitutes a solicitation, recommendation, endorsement, advertisement, or offer to buy or sell any securities, franchises, or other financial instruments, particularly in jurisdictions where such activity would be unlawful.
All content is of a general nature and may not address the specific circumstances of any individual or entity. It is not a substitute for professional advice or services. Any actions you take based on the information provided here are strictly at your own risk. You accept full responsibility for any decisions or outcomes arising from your use of this website and agree to release us from any liability in connection with your use of, or reliance upon, the content or products found herein.