
|
Bellway P.L.C. (BWY.L) Évaluation DCF |
Entièrement Modifiable: Adapté À Vos Besoins Dans Excel Ou Sheets
Conception Professionnelle: Modèles Fiables Et Conformes Aux Normes Du Secteur
Pré-Construits Pour Une Utilisation Rapide Et Efficace
Compatible MAC/PC, entièrement débloqué
Aucune Expertise N'Est Requise; Facile À Suivre
Bellway p.l.c. (BWY.L) Bundle
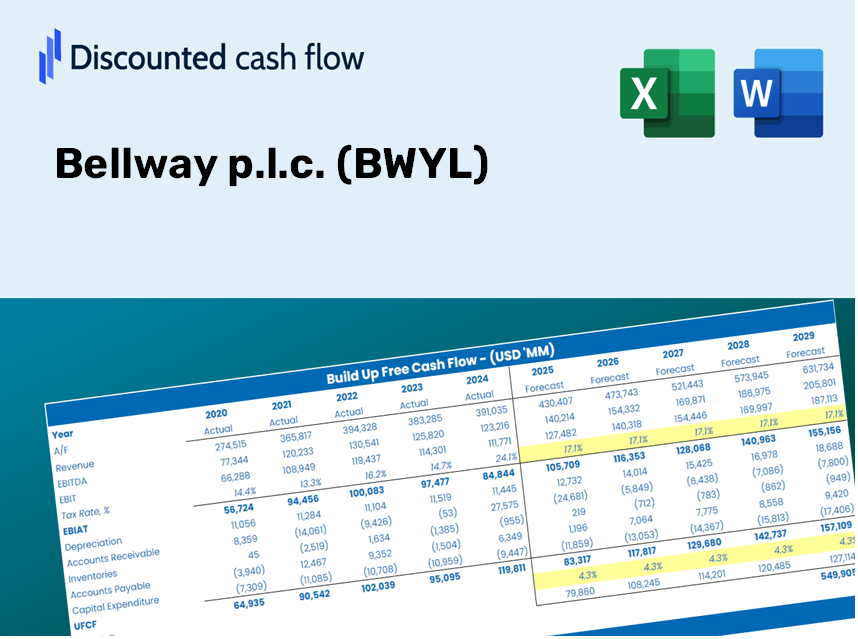
Conçu pour la précision, notre calculatrice DCF (BWYL) vous permet d'évaluer l'évaluation de Bellway P.L.C. en utilisant des données financières réelles, tout en offrant une flexibilité totale pour modifier tous les paramètres essentiels pour des projections améliorées.
Discounted Cash Flow (DCF) - (USD MM)
| Year | AY1 2020 |
AY2 2021 |
AY3 2022 |
AY4 2023 |
AY5 2024 |
FY1 2025 |
FY2 2026 |
FY3 2027 |
FY4 2028 |
FY5 2029 |
|---|---|---|---|---|---|---|---|---|---|---|
| Revenue | 2,225.4 | 3,122.5 | 3,536.8 | 3,406.6 | 2,380.2 | 2,497.8 | 2,621.3 | 2,750.8 | 2,886.8 | 3,029.5 |
| Revenue Growth, % | 0 | 40.31 | 13.27 | -3.68 | -30.13 | 4.94 | 4.94 | 4.94 | 4.94 | 4.94 |
| EBITDA | 255.6 | 486.8 | 314.7 | 510.2 | 225.1 | 301.8 | 316.7 | 332.3 | 348.8 | 366.0 |
| EBITDA, % | 11.49 | 15.59 | 8.9 | 14.98 | 9.46 | 12.08 | 12.08 | 12.08 | 12.08 | 12.08 |
| Depreciation | 6.3 | 6.5 | 6.1 | 6.0 | 5.1 | 5.3 | 5.5 | 5.8 | 6.1 | 6.4 |
| Depreciation, % | 0.2831 | 0.20817 | 0.17247 | 0.17613 | 0.21427 | 0.21083 | 0.21083 | 0.21083 | 0.21083 | 0.21083 |
| EBIT | 249.3 | 480.3 | 308.6 | 504.2 | 220.0 | 296.5 | 311.2 | 326.5 | 342.7 | 359.6 |
| EBIT, % | 11.2 | 15.38 | 8.73 | 14.8 | 9.24 | 11.87 | 11.87 | 11.87 | 11.87 | 11.87 |
| Total Cash | 51.4 | 460.3 | 375.3 | 362.0 | 119.5 | 216.4 | 227.1 | 238.3 | 250.1 | 262.4 |
| Total Cash, percent | .0 | .0 | .0 | .0 | .0 | .0 | .0 | .0 | .0 | .0 |
| Account Receivables | 55.4 | 82.2 | 114.6 | 88.3 | 76.8 | 70.8 | 74.3 | 78.0 | 81.9 | 85.9 |
| Account Receivables, % | 2.49 | 2.63 | 3.24 | 2.59 | 3.23 | 2.84 | 2.84 | 2.84 | 2.84 | 2.84 |
| Inventories | 3,863.0 | 4,032.2 | 4,423.6 | 4,575.6 | 4,714.8 | 2,497.8 | 2,621.3 | 2,750.8 | 2,886.8 | 3,029.5 |
| Inventories, % | 173.59 | 129.13 | 125.07 | 134.32 | 198.08 | 100 | 100 | 100 | 100 | 100 |
| Accounts Payable | 273.0 | 324.3 | 284.0 | 306.2 | 792.9 | 364.6 | 382.6 | 401.5 | 421.4 | 442.2 |
| Accounts Payable, % | 12.27 | 10.39 | 8.03 | 8.99 | 33.31 | 14.6 | 14.6 | 14.6 | 14.6 | 14.6 |
| Capital Expenditure | -8.3 | -3.3 | -.5 | -2.7 | -1.4 | -3.2 | -3.3 | -3.5 | -3.6 | -3.8 |
| Capital Expenditure, % | -0.37297 | -0.10568 | -0.01413707 | -0.07925791 | -0.05881859 | -0.12617 | -0.12617 | -0.12617 | -0.12617 | -0.12617 |
| Tax Rate, % | 28.96 | 28.96 | 28.96 | 28.96 | 28.96 | 28.96 | 28.96 | 28.96 | 28.96 | 28.96 |
| EBITAT | 204.0 | 400.5 | 253.9 | 379.9 | 156.3 | 233.6 | 245.1 | 257.2 | 269.9 | 283.3 |
| Depreciation | ||||||||||
| Changes in Account Receivables | ||||||||||
| Changes in Inventories | ||||||||||
| Changes in Accounts Payable | ||||||||||
| Capital Expenditure | ||||||||||
| UFCF | -3,443.4 | 259.0 | -204.6 | 279.7 | 519.0 | 2,030.3 | 138.4 | 145.2 | 152.4 | 160.0 |
| WACC, % | 10.37 | 10.38 | 10.37 | 10.3 | 10.25 | 10.33 | 10.33 | 10.33 | 10.33 | 10.33 |
| PV UFCF | ||||||||||
| SUM PV UFCF | 2,262.7 | |||||||||
| Long Term Growth Rate, % | 2.00 | |||||||||
| Free cash flow (T + 1) | 163 | |||||||||
| Terminal Value | 1,958 | |||||||||
| Present Terminal Value | 1,197 | |||||||||
| Enterprise Value | 3,460 | |||||||||
| Net Debt | 11 | |||||||||
| Equity Value | 3,450 | |||||||||
| Diluted Shares Outstanding, MM | 120 | |||||||||
| Equity Value Per Share | 2,882.38 |
What You Will Receive
- Customizable Excel Template: A fully adaptable Excel-based DCF Calculator featuring pre-filled financial data for Bellway p.l.c. (BWYL).
- Genuine Data: Access to historical figures and future projections (highlighted in the yellow cells).
- Flexible Forecasting: Adjust key assumptions such as revenue growth, EBITDA %, and WACC as needed.
- Instant Calculations: Quickly see how your inputs affect the valuation of Bellway p.l.c. (BWYL).
- Professional Resource: Designed for investors, CFOs, consultants, and financial analysts.
- Intuitive Layout: Organized for simplicity and ease of navigation, complete with step-by-step guidance.
Key Features
- 🔍 Real-Life BWYL Financials: Pre-filled historical and projected data for Bellway p.l.c.
- ✏️ Fully Customizable Inputs: Modify all essential parameters (yellow cells) such as WACC, growth %, and tax rates.
- 📊 Professional DCF Valuation: Integrated formulas determine Bellway's intrinsic value using the Discounted Cash Flow method.
- ⚡ Instant Results: View Bellway's valuation immediately after making adjustments.
- Scenario Analysis: Analyze and compare outcomes for different financial assumptions in a side-by-side format.
How It Functions
- Download: Obtain the pre-configured Excel file featuring Bellway p.l.c.'s (BWYL) financial data.
- Customize: Modify forecasts, such as revenue growth, EBITDA percentage, and WACC.
- Automatic Updates: The intrinsic value and NPV calculations refresh in real-time.
- Scenario Testing: Develop multiple projections and compare results instantly.
- Informed Decisions: Leverage the valuation findings to shape your investment strategy.
Why Choose the Bellway p.l.c. (BWYL) Calculator?
- Precision: Utilizes accurate financial data from Bellway p.l.c. for reliable results.
- Adaptability: Crafted for users to easily test and adjust inputs to suit their needs.
- Efficiency: Avoid the complexity of creating a financial model from the ground up.
- Industry-Standard: Built with the expertise and usability expected by financial leaders.
- Accessible: Designed to be intuitive, making it suitable for users with varying levels of financial expertise.
Who Should Consider Bellway p.l.c. (BWYL)?
- Investors: Assess the true value of Bellway p.l.c. (BWYL) for informed investment decisions.
- CFOs: Utilize a high-quality DCF model for accurate financial reporting and analysis.
- Consultants: Efficiently modify the template for client valuation reports.
- Entrepreneurs: Discover financial modeling techniques employed by leading construction firms.
- Educators: Implement it as a resource to illustrate valuation practices.
Contents of the Template
- Pre-Filled Data: Contains Bellway p.l.c.'s historical financial data and projections.
- Discounted Cash Flow Model: An editable DCF valuation model with automatic computational features.
- Weighted Average Cost of Capital (WACC): A dedicated worksheet for computing WACC based on user-defined inputs.
- Key Financial Ratios: Evaluate Bellway p.l.c.'s profitability, operational efficiency, and financial leverage.
- Customizable Inputs: Easily modify revenue growth rates, profit margins, and tax rates.
- Clear Dashboard: Visual representations and tables that summarize essential valuation outcomes.
Disclaimer
All information, articles, and product details provided on this website are for general informational and educational purposes only. We do not claim any ownership over, nor do we intend to infringe upon, any trademarks, copyrights, logos, brand names, or other intellectual property mentioned or depicted on this site. Such intellectual property remains the property of its respective owners, and any references here are made solely for identification or informational purposes, without implying any affiliation, endorsement, or partnership.
We make no representations or warranties, express or implied, regarding the accuracy, completeness, or suitability of any content or products presented. Nothing on this website should be construed as legal, tax, investment, financial, medical, or other professional advice. In addition, no part of this site—including articles or product references—constitutes a solicitation, recommendation, endorsement, advertisement, or offer to buy or sell any securities, franchises, or other financial instruments, particularly in jurisdictions where such activity would be unlawful.
All content is of a general nature and may not address the specific circumstances of any individual or entity. It is not a substitute for professional advice or services. Any actions you take based on the information provided here are strictly at your own risk. You accept full responsibility for any decisions or outcomes arising from your use of this website and agree to release us from any liability in connection with your use of, or reliance upon, the content or products found herein.