
|
Bytes Technology Group plc (byit.l) Valation DCF |
Entièrement Modifiable: Adapté À Vos Besoins Dans Excel Ou Sheets
Conception Professionnelle: Modèles Fiables Et Conformes Aux Normes Du Secteur
Pré-Construits Pour Une Utilisation Rapide Et Efficace
Compatible MAC/PC, entièrement débloqué
Aucune Expertise N'Est Requise; Facile À Suivre
Bytes Technology Group plc (BYIT.L) Bundle
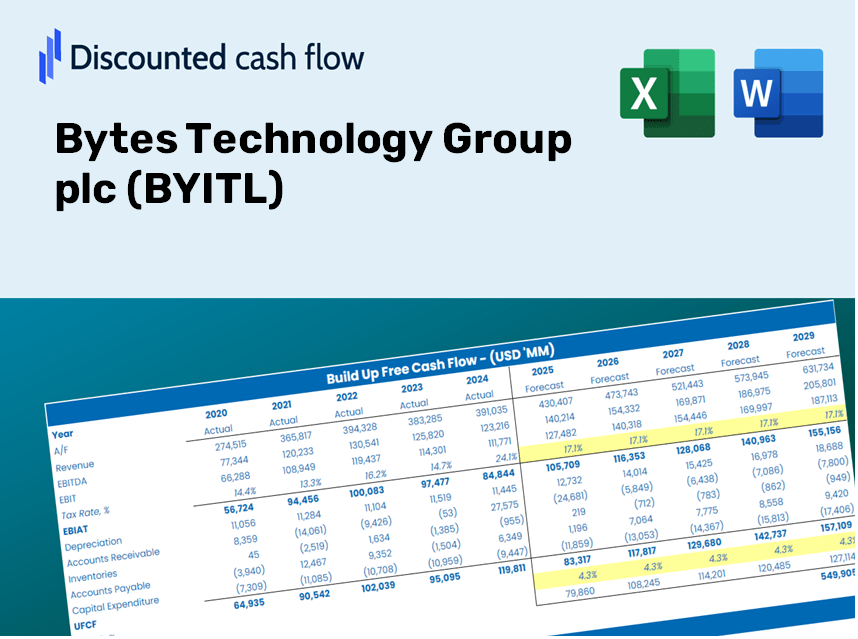
Simplifiez l'évaluation des Bytes Technology Group PLC (BYITL) avec cette calculatrice DCF personnalisable! Doté de Real Bytes Technology Group Plc (BYITL) Financials and Adjustable Prévision des intrants, vous pouvez tester les scénarios et découvrir Bytes Technology Group Plc (BYITL) juste la juste valeur en minutes.
What You Will Receive
- Authentic BYITL Financials: Comprehensive historical and projected data for precise valuation.
- Customizable Parameters: Adjust WACC, tax rates, revenue growth, and capital expenditures as needed.
- Automated Calculations: Intrinsic value and NPV are computed in real-time.
- Scenario Analysis: Explore various scenarios to assess BYITL's potential future performance.
- User-Friendly Design: Tailored for professionals while remaining accessible to newcomers.
Key Features
- Customizable Financial Inputs: Adjust essential factors such as revenue growth, EBITDA margin, and capital investment.
- Instant DCF Valuation: Automatically determines intrinsic value, net present value, and other financial metrics with ease.
- Industry-Leading Precision: Leverages real financial data from Bytes Technology Group plc (BYITL) to deliver accurate valuation results.
- Simplified Scenario Testing: Effortlessly evaluate various assumptions and analyze different outcomes.
- Efficiency Boost: Streamline your workflow by avoiding the complexities of creating detailed valuation models from the ground up.
How It Works
- 1. Access the Template: Download and open the Excel file containing Bytes Technology Group plc’s (BYITL) preloaded data.
- 2. Adjust Assumptions: Modify key parameters such as growth rates, WACC, and capital expenditures to fit your analysis.
- 3. View Instant Results: The DCF model automatically computes intrinsic value and NPV based on your inputs.
- 4. Explore Scenarios: Evaluate various forecasts to understand different valuation possibilities.
- 5. Use with Assurance: Provide professional valuation insights to bolster your decision-making process.
Why Opt for This Calculator?
- Precision: Utilizes actual Bytes Technology Group plc (BYITL) financial data for reliable results.
- Versatility: Built to allow users to freely test and adjust inputs.
- Efficiency: Eliminate the need to construct a DCF model from the ground up.
- Executive-Level Quality: Crafted with the accuracy and ease of use expected by CFOs.
- Accessible: Designed for simplicity, making it suitable for users with varying levels of financial expertise.
Who Can Benefit from Using Bytes Technology Group plc (BYITL)?
- Investors: Utilize a robust valuation tool to inform and enhance your investment choices.
- Financial Analysts: Streamline your workflow with an adaptable DCF model designed for efficiency.
- Consultants: Effortlessly modify the template for impactful client presentations and reports.
- Finance Enthusiasts: Expand your knowledge of valuation methods through practical, real-world applications.
- Educators and Students: Leverage this resource as a hands-on learning aid in finance courses.
Contents of the Template
- Pre-Filled DCF Model: BYITL's financial data ready for immediate analysis.
- WACC Calculator: Comprehensive calculations for Weighted Average Cost of Capital.
- Financial Ratios: Assess BYITL's profitability, leverage, and operational efficiency.
- Editable Inputs: Adjust assumptions such as growth rates, profit margins, and CAPEX to suit your scenarios.
- Financial Statements: Annual and quarterly reports provided for in-depth analysis.
- Interactive Dashboard: Effortlessly visualize essential valuation metrics and outcomes.
Disclaimer
All information, articles, and product details provided on this website are for general informational and educational purposes only. We do not claim any ownership over, nor do we intend to infringe upon, any trademarks, copyrights, logos, brand names, or other intellectual property mentioned or depicted on this site. Such intellectual property remains the property of its respective owners, and any references here are made solely for identification or informational purposes, without implying any affiliation, endorsement, or partnership.
We make no representations or warranties, express or implied, regarding the accuracy, completeness, or suitability of any content or products presented. Nothing on this website should be construed as legal, tax, investment, financial, medical, or other professional advice. In addition, no part of this site—including articles or product references—constitutes a solicitation, recommendation, endorsement, advertisement, or offer to buy or sell any securities, franchises, or other financial instruments, particularly in jurisdictions where such activity would be unlawful.
All content is of a general nature and may not address the specific circumstances of any individual or entity. It is not a substitute for professional advice or services. Any actions you take based on the information provided here are strictly at your own risk. You accept full responsibility for any decisions or outcomes arising from your use of this website and agree to release us from any liability in connection with your use of, or reliance upon, the content or products found herein.